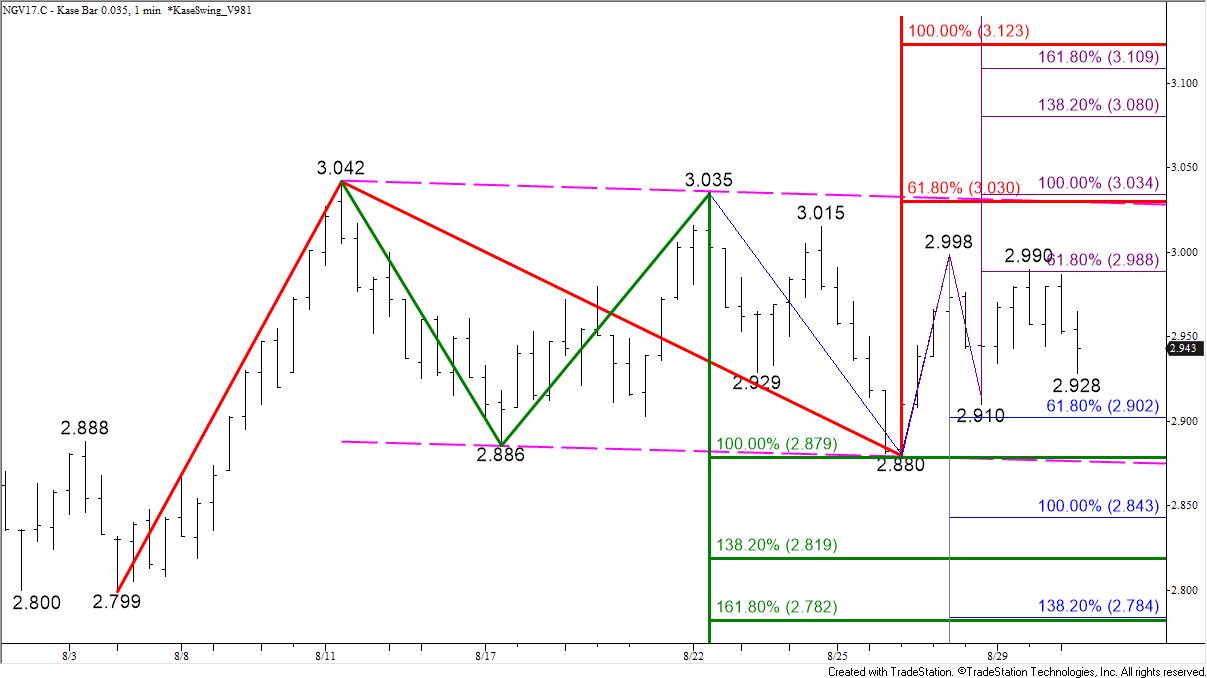
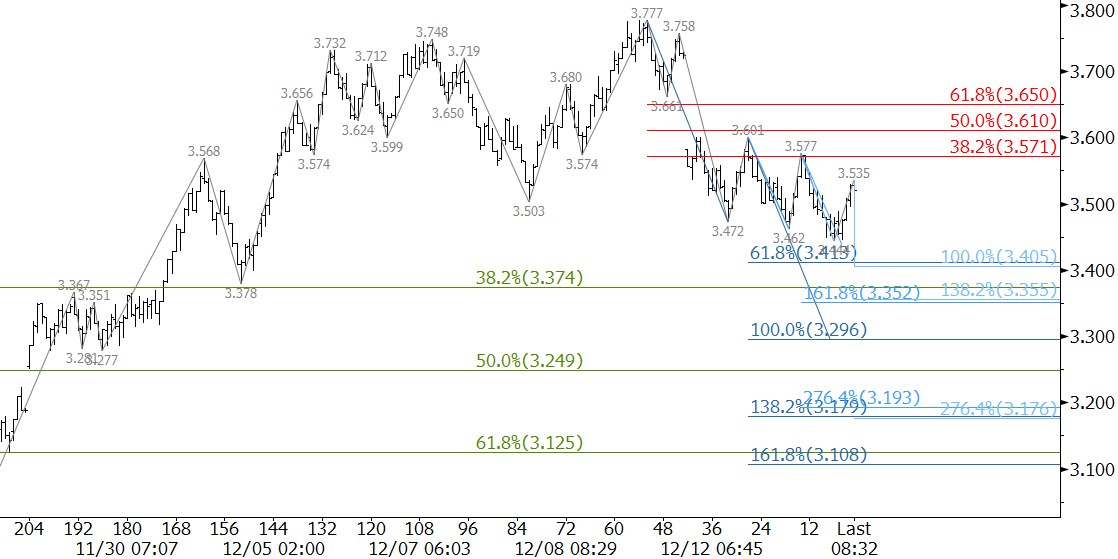
Yesterday’s decline was a dose of reality that has set natural gas back into a state of uncertainty. With all factors considered, October natural gas will most likely settle back into a neutral trading range between nominally $2.91 and $3.04. This is about the same range prices oscillated within before last Thursday’s break high out of the bullish flag.
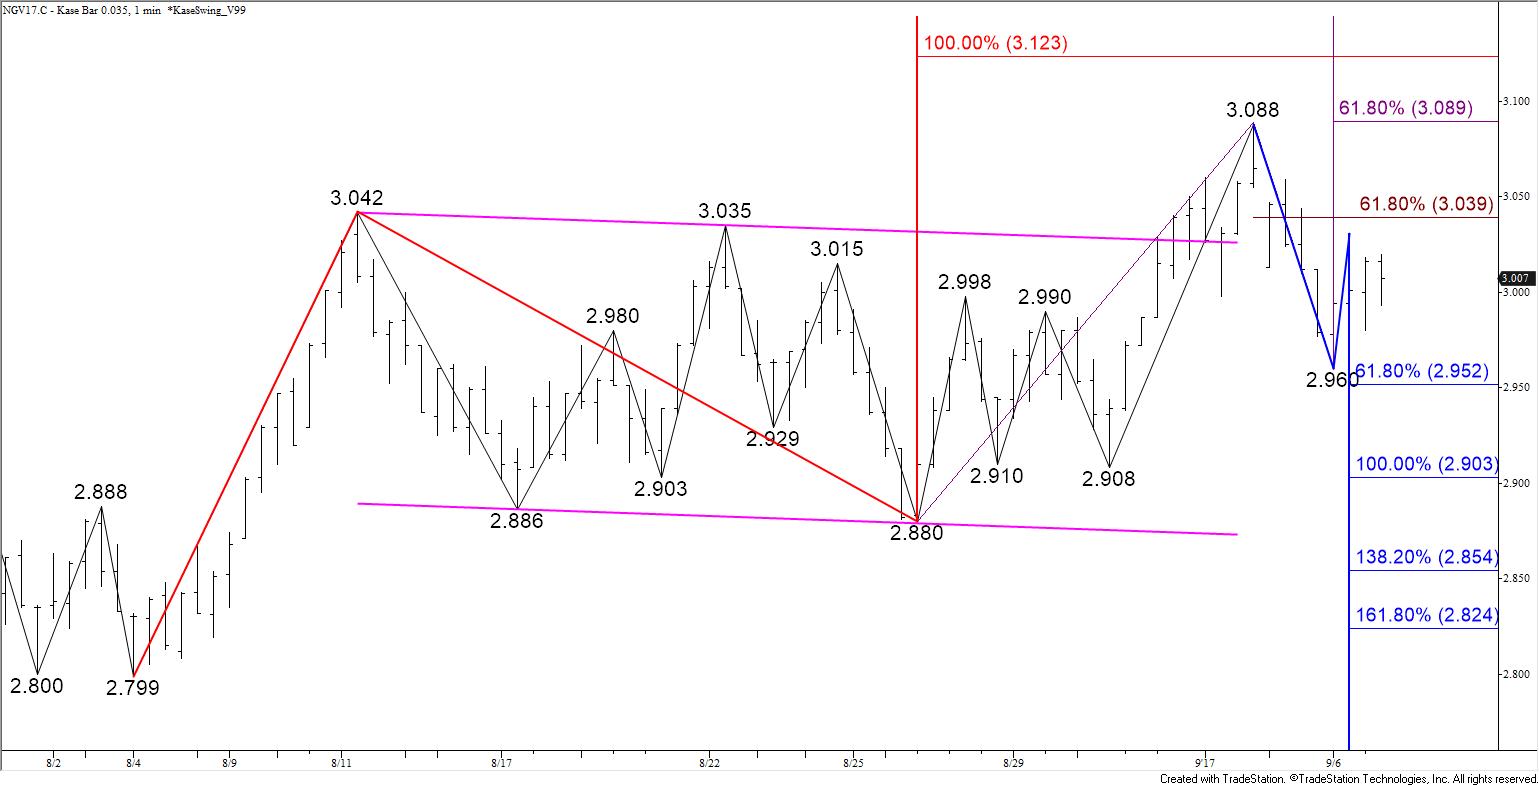
The wave formation down from $3.088 and a bearish daily KaseCD divergence call for $2.95, which then connects to $2.91. A close below $2.91 would call for $2.85, which in turn, would take out the crucial $2.88 swing low. A move below $2.88 would wipe out the wave up from $2.799 that projects to key upper resistance at $3.12.
That said, the 50-day moving average has held, so there is a modest chance the wave up from today’s $2.96 low could extend to $3.04 first. At this point we expect $3.04 to hold. However, a close above this would call for another attempt at $3.09 and possibly $3.12.
This is a brief analysis for the next day or so. Our weekly Natural Gas Commentary and daily updates are much more detailed and thorough energy price forecasts that cover key natural gas futures contracts, calendar spreads, the UNG ETF, and several electricity contracts. If you are interested in learning more, please sign up for a complimentary four-week trial.