Crude Oil Forecast: WTI Forms Intra-Day Bullish Flag

The long-term outlook for WTI crude oil remains negative and it is too soon to state that a bottom has been made. However, last Friday, June WTI met major support at $43.76, the 1.00 projection of the wave $57.95 – 47.58 – 54.14 (exact projection was $43.77). This was also in the realm of the August 2016 swing low of $44.56 and the 62 percent retracement of the move up from $36.18 to $57.95 ($44.5). The confluence of support between $43.77 and $44.56 and the fact that this range has held on a closing basis favors a larger upward correction before the decline continues.

In addition to meeting support at $43.76, June WTI confirmed daily bullish divergences on the KaseCD and Stochastic and a bullish KasePO PeakOut (oversold signal). These signals call for the upward correction to extend. Most importantly, over the past two days, the pullback from $46.98 formed a bullish intraday flag, shown below on the $0.35 Kase Bar chart.

June 2017 WTI Crude Oil - $0.35 Kase Bar Chart
June 2017 WTI Crude Oil – $0.35 Kase Bar Chart

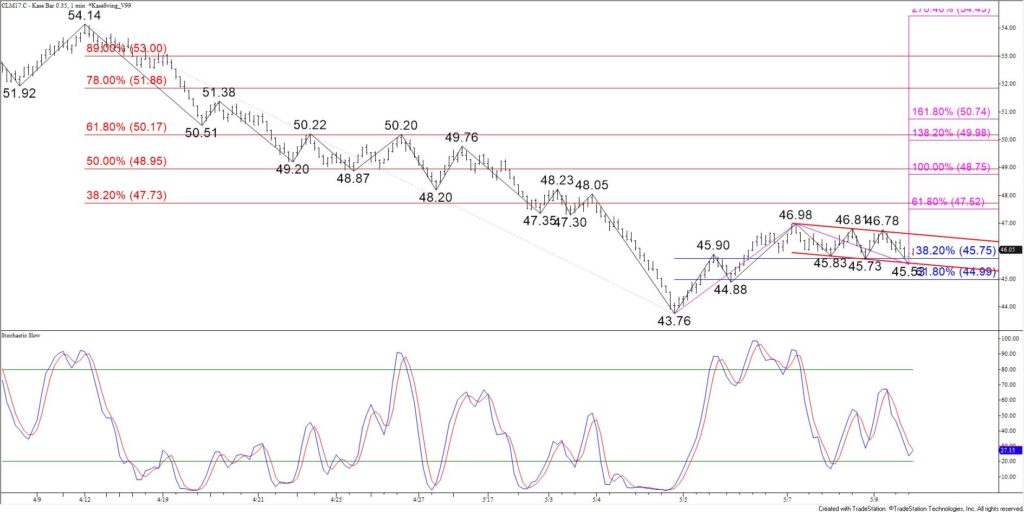
For now, according to Kase’s price forecasting model, odds are 65 percent for a break higher out of the flag. These odds will increase as prices rise toward the upper trendline of the flag at $46.6.

Important resistance at $47.6 should be challenged upon a break higher out of the flag. This is the confluence point between the 38 percent retracement of the decline from $54.14 to $43.76 and the 0.618 projection of the wave $43.76 – 46.98 – 45.53.

That said, there are some danger signs that indicate the flag, and other bullish technical factors, are on the teetering edge of failing.

The key to a break higher out of the flag and extended upward correction is holding support at $45.5. This is in line with the today’s $45.53 swing low and the flag’s lower trendline. A close below this would call for a test of $45.0, the 62 percent retracement of the move up from $43.76 to $46.98. Settling below $45.0 would shift near-term odds back in favor of testing the $43.76 low again.

This is a brief analysis and outlook for the next day or so. Our weekly Crude Oil Commentary and intra-week updates are much more detailed and thorough energy price forecasts that cover WTI, Brent, RBOB Gasoline, Diesel, and spreads. If you are interested in learning more, please sign up for a complimentary four-week trial.

Day-to-day speculation regarding summer weather forecasts continue to dominate short-term natural gas prices. The lack of clarity has caused natural gas to settle into a range between $2.55 and $2.95 after failing to close over the upper end of the range last week.

Technical factors show that prices are due for a test of the lower end of the range where contract lows will be challenged. Because the wave down from $2.955 (shown in red) met its 0.618 projection we expect to see at least its 1.00 projection of $2.62. This is also the 0.618 for the wave down from $3.105 (shown in blue).

natural gas prices

That said, it is still early for support to give way to the longer-term bearish trend, so the decline will likely be a grind. Support at $2.71 is holding strong, but a disappointing EIA storage report tomorrow would clear the way for $2.62. This is a confluence point just like $2.71, so $2.62 should hold.

Key resistance is $2.83 because it is in line with the $2.837 swing high. Overcoming $2.837 will take out the wave down from $2.955 and negate the near-term potential for $2.62.

This is a brief natural gas forecast ahead of tomorrow’s EIA report. Our weekly Natural Gas Commentary is a much more detailed and thorough analysis. If you are interested, please sign up for a complimentary four week trial.

For several weeks $2.79 was major support for natural gas. This level was tested many times, and was finally broken after last week’s bearish U.S. Energy Information Administration (EIA) Natural Gas Weekly Update.

Subsequently, prices have fallen to a $2.608 contract low, and $2.79 has become near-term resistance. The $2.79 level is the completion point for a bullish morning star setup, and was tested on Tuesday when prices rose to $2.783. This level is expected to hold for at least the next few days.

NGH5

As of this analysis, Wednesday’s decline has setup a pseudo bearish engulfing line. The bearish engulfing line and other technical factors indicate another bearish EIA number may be expected tomorrow.

Trading will likely be extremely choppy over the next few days, but look for $2.79 to hold and for prices to challenge the $2.608 swing low. Ultimately, the decline is expected to extend to the next major target and bearish decision point at $2.52.

Conversely, a close over $2.79 in the next few days would complete the bullish morning star setup and open the way for an extended correction to the $2.852 confirmation point.

For more information about Kase StatWare please visit the Trading Indicators Page. To take a free trial of Kase’s weekly energy forecasts please visit the Energy Price Forecasts Page.

NY Harbor ULSD future’s upward correction extended to 177.7 on Monday. The primary wave 158.9 – 171.7 – 160.5, met its 1.382 projection at 177.7 and is poised to extend to the 1.618 projection of 184.2. This is the decision point for an extended correction and potential recovery. Although it is too early to say that a bottom has been made, a sustained close over 184.2 would open the way for 198.7 and 217.7. A close below 164.3 would indicate the upward correction is complete and call for 153.2 and lower.

To learn more about Kase’s forecasts please visit the Energy Price Forecasts Page.

HO


Kase’s senior analyst Dean Rogers reviews trade setups and price forecasts for e-mini S&P 500, AAPL, and MSFT, using Kase Wave Analysis and Kase StatWare.

http://youtu.be/SZ-ipWldKTc


Kase’s senior analyst Dean Rogers reviews trade setups and price forecasts for e-mini S&P 500, crude oil, natural gas, AAPL, and VIPS using Kase Outlook, Kase StatWare, and KaseX.

http://youtu.be/pLCujMm5-WE

The WTI-Brent spread narrowed last week, but the move looks corrective. The spread will likely oscillate for the near-term, but ultimately odds favor a widening spread. The first target is (5.00), and a close below this would call for (6.50) and (9.00). Key long-term support is (11.80). This is a confluent wave projection and the 62 percent retracement from (19.38) to (0.01). Resistance at (0.90) should hold. A sustained close over (0.90) would open the way for 1.30 and 2.90.

For more information and to take a trial of Kase’s weekly energy forecasts please visit the Energy Price Forecasts page.

WTI-Brent


This is the fourth of a four part series on Kase Wave Analysis. In this video Kase’s senior analyst, Dean Rogers, shows how the Kase Wave Analysis can be combined with other technical factors and indicators to make trading decisions.

http://youtu.be/3JcHjdr2QWM

This is the third of a four part series on Kase Wave Analysis. In this video Kase’s senior analyst, Dean Rogers, demonstrates how to identify confluent support and resistance levels using Fibonacci wave projections. This is “where the rubber meets the road” with Kase Wave Analysis. Upon completion of this session you will be able to identify the key support and resistance levels using Kase Wave analysis.

Identify and remove wave projections that have been met by using swing highs and lows
Calculate True Range and determine an appropriate cluster size for confluence points
Demonstrate the ability to cluster wave projections into confluence points
Explain which support and resistance targets are the most crucial based upon confluence

http://youtu.be/aEQsFj-DRJ8