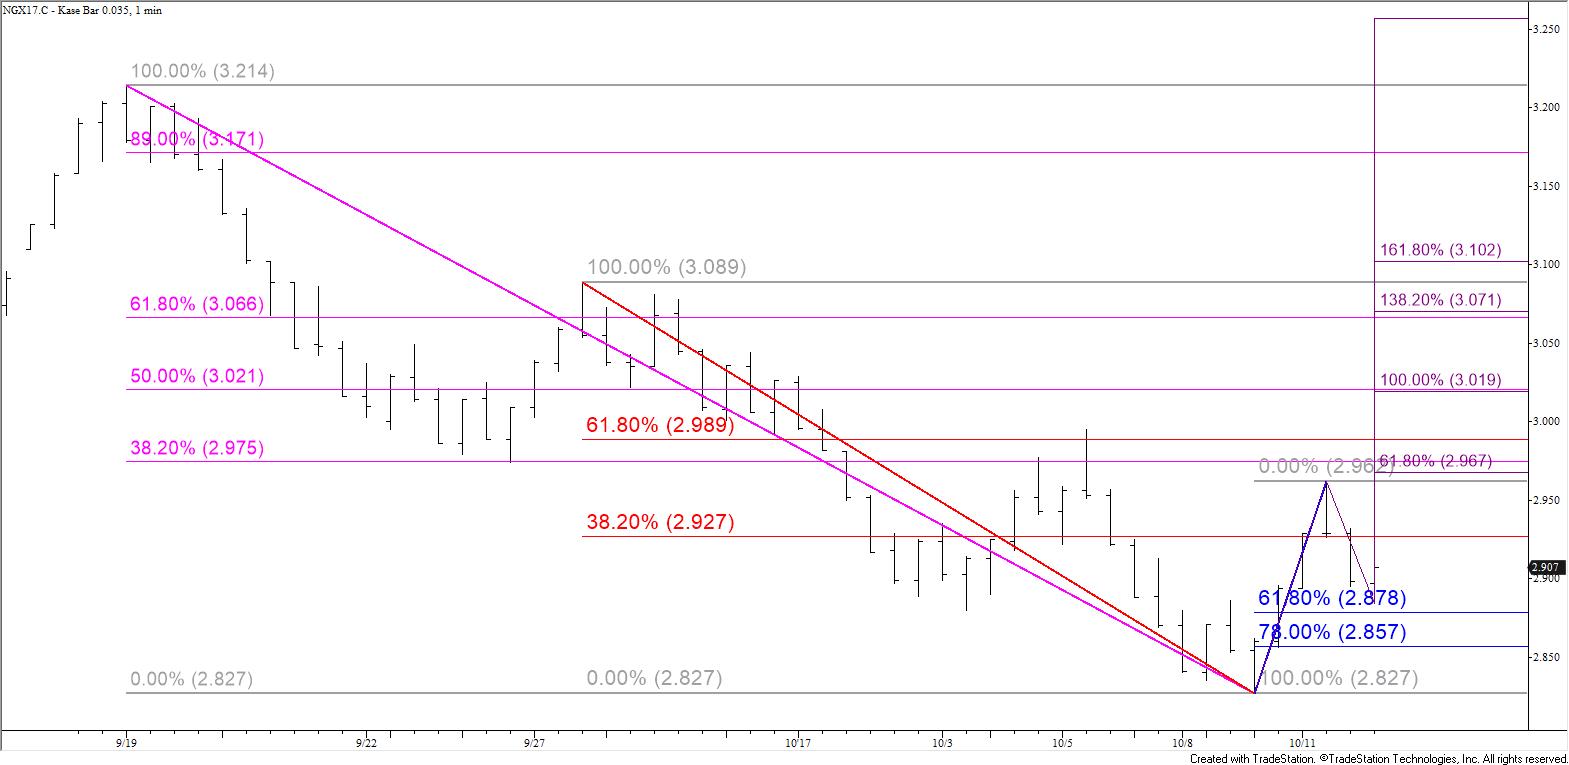
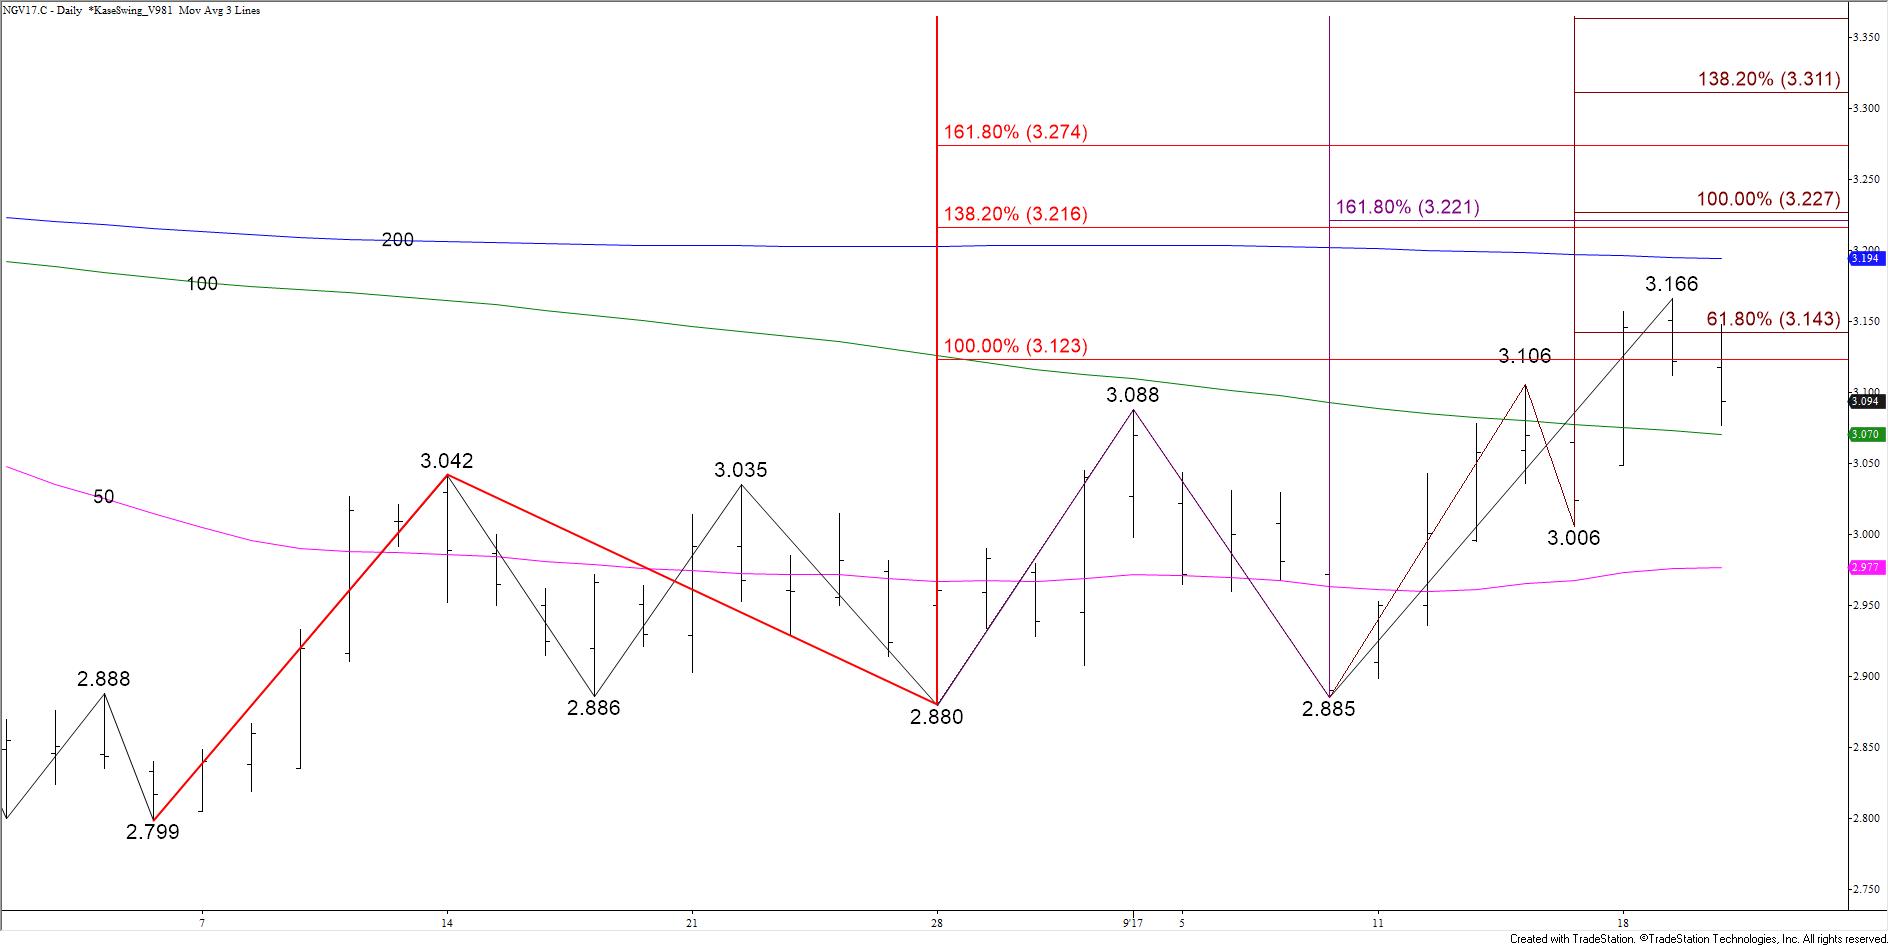
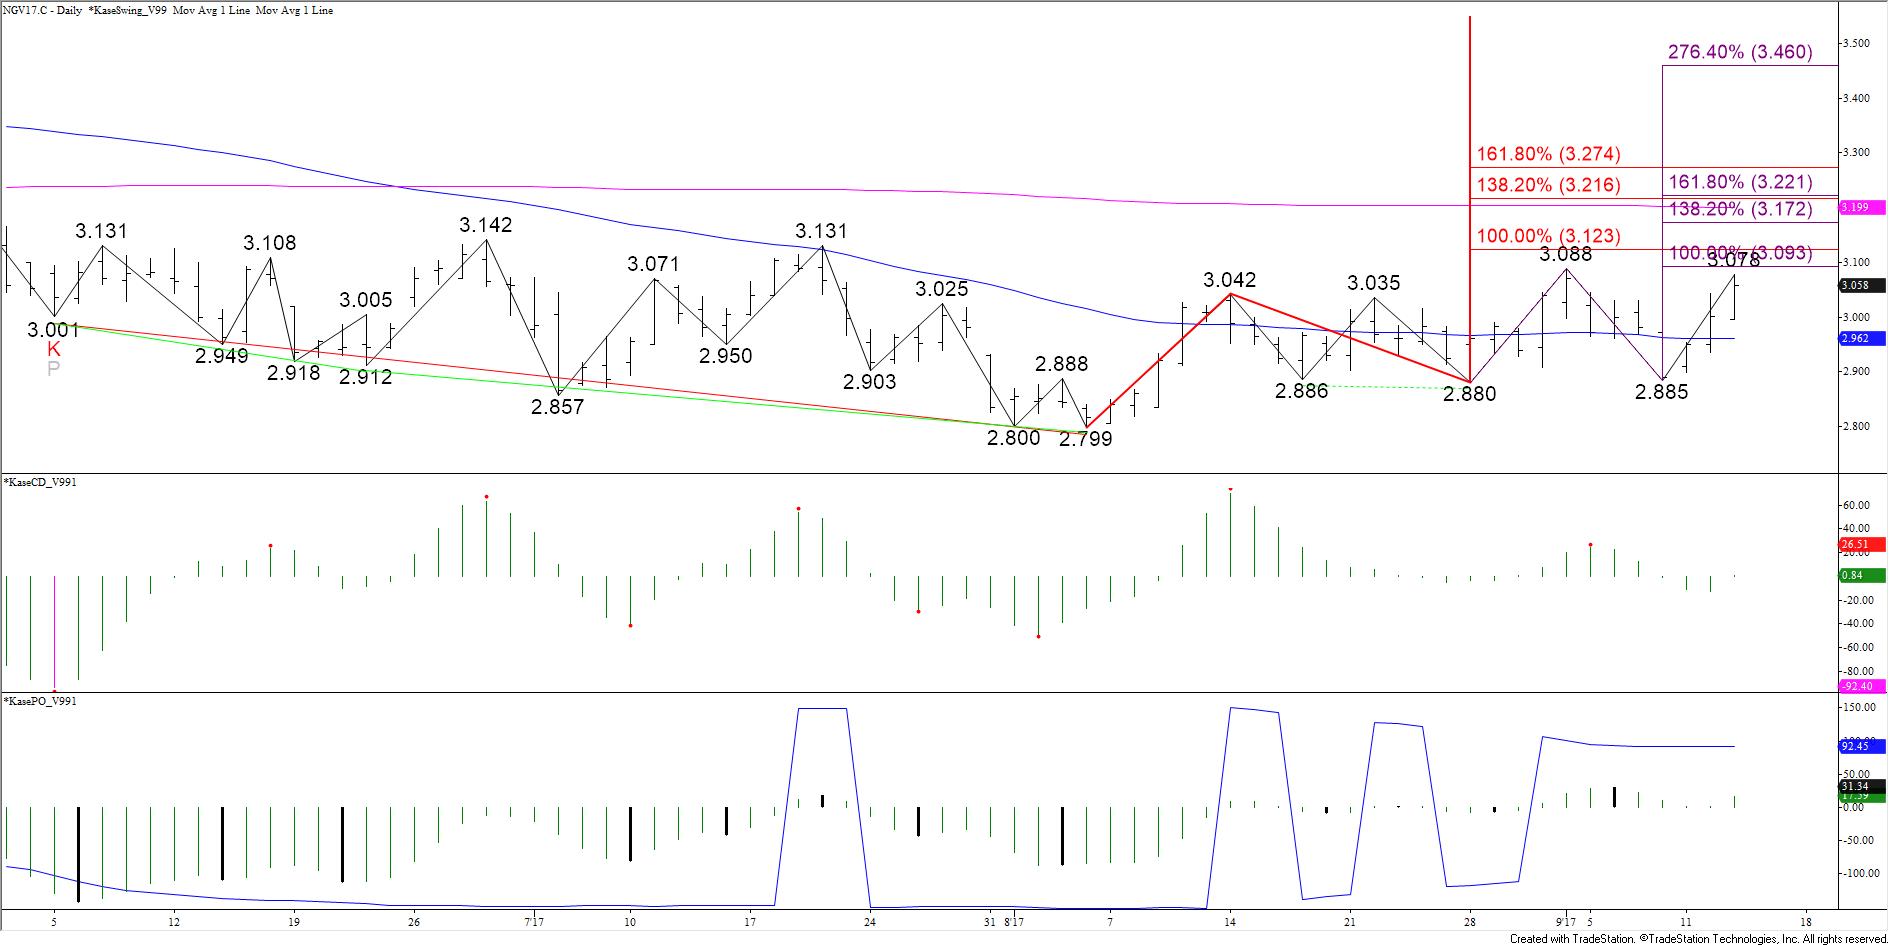
November natural gas met support at $2.85, the intermediate (1.382) target of the wave $3.036 – 2.908 – 3.026. This wave is now in position to extend to its $2.81 larger than (1.618) target. This is an important objective because it is also the smaller than (0.618) target of the waves $3.214 – 2.827 – 3.036 and $3.561 – 2.886 – 3.214. Settling below $2.81 would open the way for a more negative near-term outlook.
Due to the confluence and importance of $2.81, once this target is met there is a reasonable chance another test of resistance will take place before prices fall much lower. Initial resistance is $2.89 and then $2.92. A normal correction should hold $2.92 because this is the 38 percent retracement of the decline from $3.036.
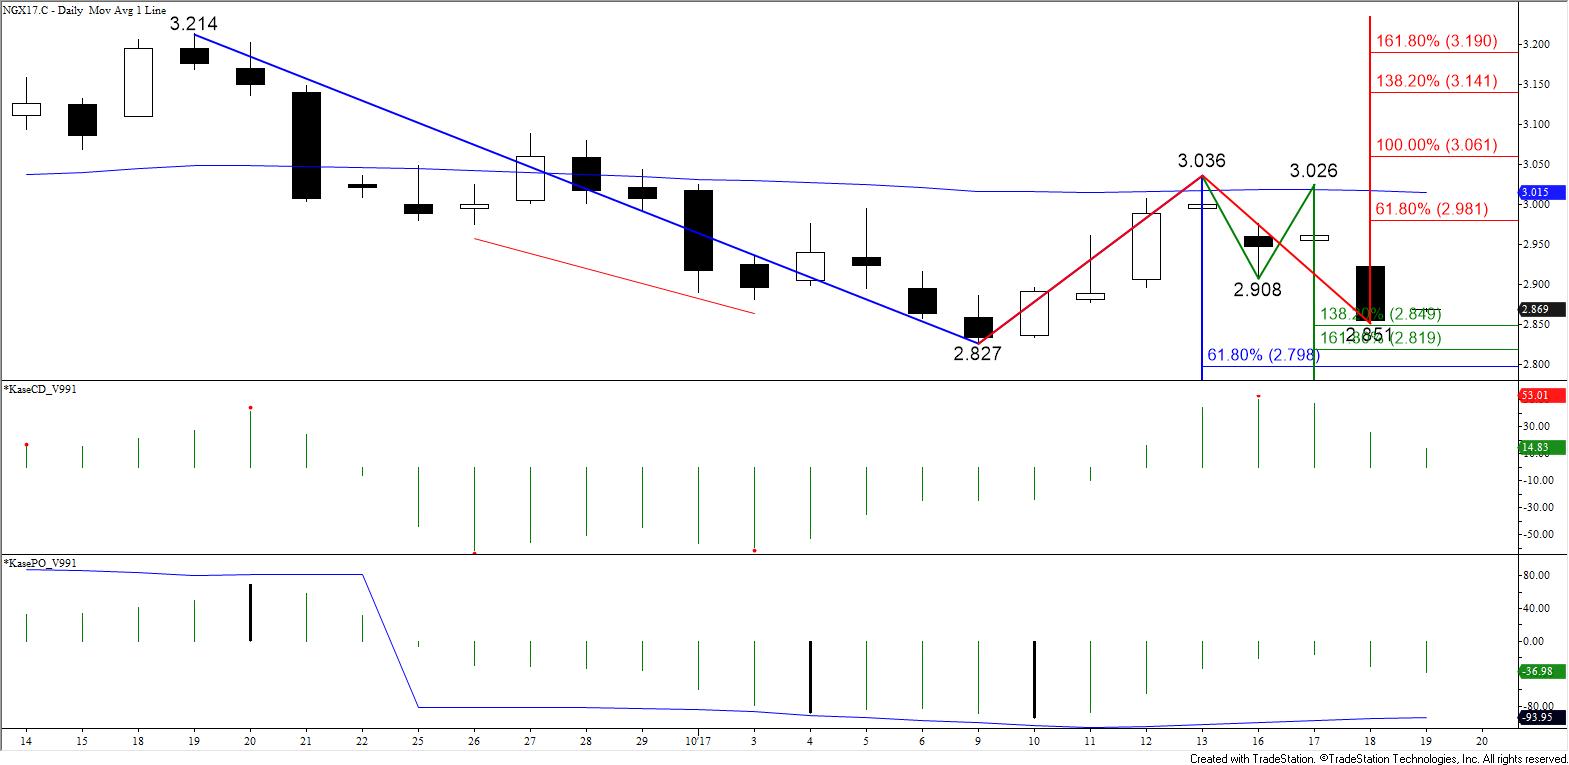
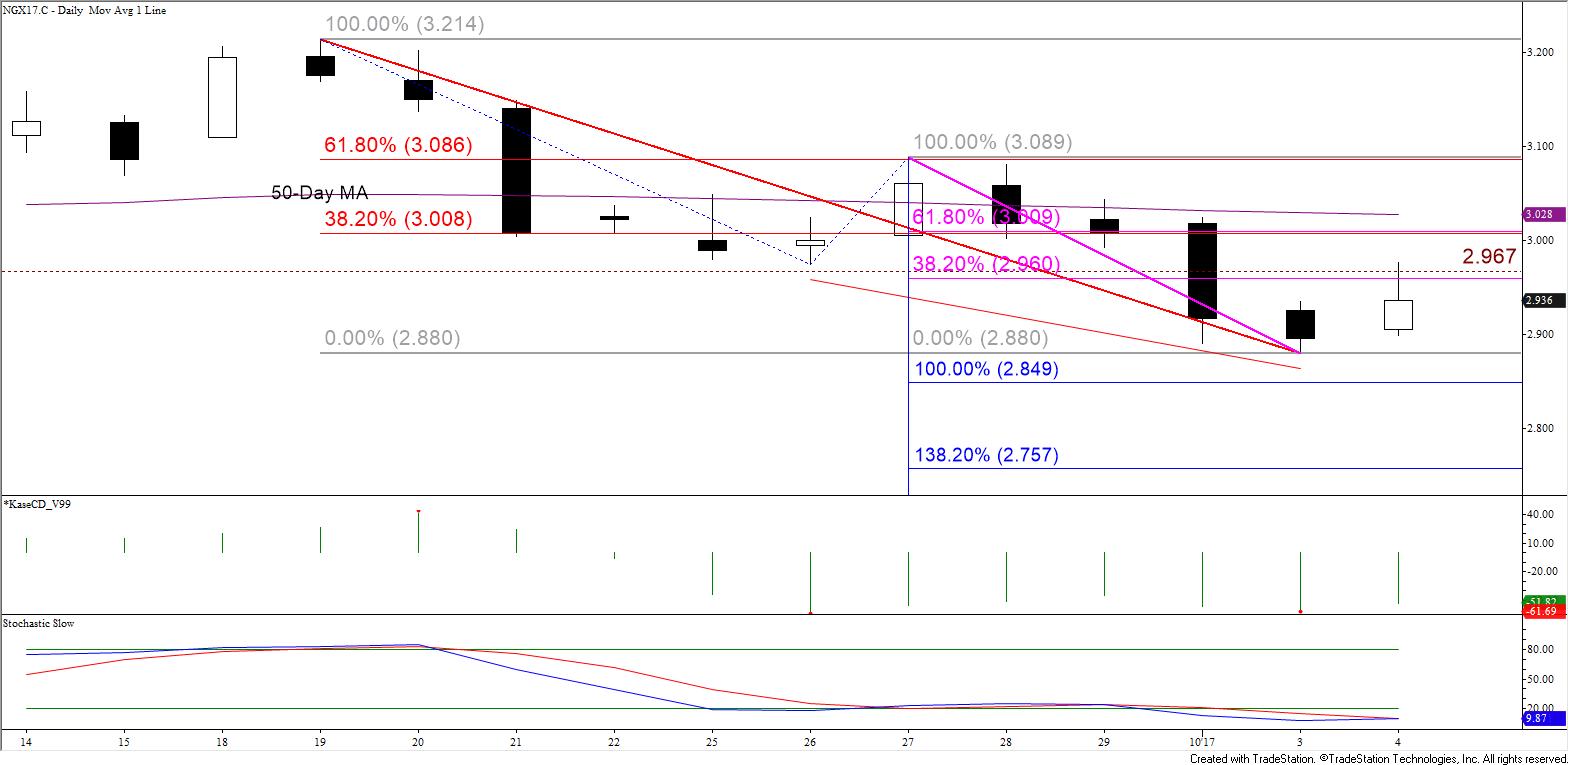
Key resistance for the near-term is $2.97, the 62 percent retracement. A close above this would call for another attempt at $3.02, the 50 percent retracement of the decline from $3.214 and the 50-day moving average.
At this point, aside from confluent support at $3.81, there is very little technical evidence that indicates the move down will end soon. This may change as withdraw season approaches and weather gets cooler. However, for now, odds have shifted back in favor of a continued decline to challenge the continuation charts $2.753 swing low.
This is a brief analysis for the next day or so. Our weekly Natural Gas Commentary and daily updates are much more detailed and thorough energy price forecasts that cover key natural gas futures contracts, calendar spreads, the UNG ETF, and several electricity contracts. If you are interested in learning more, please sign up for a complimentary four-week trial.