KaseX
Simple. Sophisticated. Statistically Derived.
KaseX is a trading mega-indicator that condenses the full power of Kase StatWare® into intuitive, color-coded symbols for entries, exits, and stops. No indicator interpretation. No manual optimization. Just clear, statistically grounded signals on any liquid market.
Built for Traders Who Want Power Without Complexity
KaseX is designed for traders who want the analytical depth of Kase StatWare® in a streamlined, easy-to-read display. It serves a wide range of market participants across every asset class and experience level:
Active Commodity Traders
Statistically derived entry, stop, and exit signals for energy, metals, agricultural, and livestock futures with no manual adjustment required.
Equity & Index Traders
Clean, color-coded signals that work across all liquid and active stocks, ETFs, and equity index futures on any bar type.
Forex Traders
Self-optimizing signals that adapt automatically to the volatility characteristics of currency markets without parameter tuning.
Traders Seeking a Simpler Approach
For traders who want the analytical depth of Kase StatWare® without managing multiple indicators, KaseX condenses the full system into a single, clean display.
Experienced StatWare® Users
A streamlined alternative to the full StatWare® suite — consolidating the same underlying analysis into a single, clean indicator display.
Independent & Private Traders
Professional-grade statistical signals with a simple interface. Ideal for traders who want an edge without the learning curve.
The Full Depth of StatWare®. The Simplicity of Four Symbols.
KaseX is built on the same statistical and mathematical foundations as Kase StatWare® — the same momentum indicators, the same volatility-adaptive stops, the same multi-timeframe filtering system. What changes is the display. Where StatWare® surfaces each indicator individually, KaseX synthesizes the output of the entire system into four symbol types: darts and diamonds for entries, arrows for exits, and dashes for stops.
The result is a single indicator that tells you when to enter a trade, when to exit, and where to set your stops — without requiring any interpretation of underlying oscillators or manual tuning of parameters. The algorithm self-adjusts and optimizes settings automatically, analyzing multiple timeframes simultaneously and embedding a longer bar-length filter directly into the entry signals.
KaseX works with all bar types — time-based, tick, volume, and Kase and other range bars — and is compatible with all liquid and active stocks, commodities, futures, indices, and Forex.
KaseX Overview
Watch this overview to see KaseX in action — covering the entry darts and diamonds, exit arrows, and statistically derived stop dashes across a live market example.
Four Symbol Types. A Complete Trading System.
Every KaseX signals are derived from the underlying Kase StatWare® studies and are condensed into a clean, color-coded display that covers the full trade lifecycle:
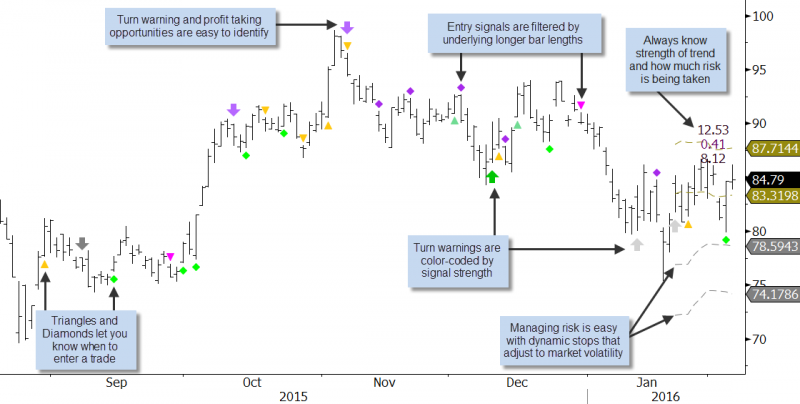
KaseX on a chart — entry darts and diamonds, color-coded exit arrows, and Dash stop levels plotted directly on the price bars.
Entry Signals — Darts and Diamonds
KaseX generates four types of entry signals displayed as darts (triangles) and diamonds. Each shape and color reflects both signal type and strength, with the algorithm examining underlying momentum, a longer bar-length filter, and bar pattern recognition simultaneously. Darts are unfiltered signals where the trading bar and longer bar-length filter are permissioned in opposite directions. Diamonds are stronger signals than darts because the trading bar and longer bar-length filter are permissioned in the same direction.
- Yellow Dart — warning signal; market is setting up for a potential entry. Wait for a pullback that holds the prior swing before entering
- Cyan Dart — unfiltered long entry signal
- Magenta Dart — unfiltered short entry signal
- Green Diamond — filtered long entry signal
- Purple Diamond — filtered short entry signal
- Pierced Dart or Diamond — entry signal coinciding with an exit arrow; strong stop-and-reverse signal for aggressive traders
Stops — Dash1 and Dash2
KaseX’s stop levels — called Dashes — are statistically derived from Kase’s volatility-adaptive stop framework, accounting for both typical risk and outlier risk. Two levels are displayed above and below the market at all times.
- Dash1 — tighter stop level, closest to market price
- Dash2 — wider stop level, used in trending markets
- Olive green dashes trail in the direction of the trend; gray dashes trail in the opposite direction
- All levels adapt automatically to current market volatility — no manual adjustment required
Exit Signals — Arrows
KaseX’s exit signals are derived from Kase’s KasePO and KaseCD momentum indicators, synthesized into a single set of color-coded arrows. Arrow direction coincides with the direction of the potential market turn.
- Hollow (or light gray) arrow — weak momentum signal; tighten stops to Dash1 but an immediate exit is not usually called for
- Gray arrow — overbought or oversold momentum signal; tighten stops to Dash1 and consider taking partial profit
- Colored arrow (green or red) — momentum divergence signal; consider exiting 50–80% of the position and managing the remainder with Dash1
Kaos Ratio and Risk Indicator
Two additional display elements help traders assess market conditions and risk before and during a trade:
- Kaos Ratio — measures the ratio of risk variation to average risk. A reading of 0.40 or lower indicates a more tradable, trending market. Higher readings indicate choppy or erratic conditions
- Risk Indicator — displays the exact dollar risk per unit associated with Dash1 and Dash2, enabling precise position sizing before entry
Built for Precision. Designed for Simplicity.
KaseX brings the statistical rigor of Kase StatWare® to a single, streamlined indicator — delivering every advantage without the complexity:
No Indicator Interpretation
All underlying analysis — momentum, multi-timeframe filtering, volatility, bar patterns — is synthesized into four simple symbol types. No oscillator panels to read or interpret.
Self-Optimizing Algorithm
KaseX automatically adjusts and optimizes all settings for the market and bar length being traded — eliminating the need for manual parameter tuning or ongoing optimization.
Multi-Timeframe Analysis Built In
A longer bar-length filter is embedded directly into the entry signal algorithm — distinguishing filtered (stronger) Diamond signals from unfiltered Dart signals without requiring a second chart.
Statistically Derived Stops
Dash stops are set at statistically significant volatility levels — accounting for both typical and outlier risk — and adapt automatically to changing market conditions.
Built-In Market Tradeability Gauge
The Kaos Ratio tells you at a glance whether a market or bar length is trending and tradeable — helping you avoid entries in choppy, erratic conditions.
Exact Risk Per Unit Display
The Risk Indicator shows the precise dollar risk at Dash1 and Dash2 before you enter a trade — supporting systematic position sizing, risk management, and bar size selection.
A Simple Three-Step Trading Process
KaseX guides you through a disciplined, repeatable process for every trade — with all the underlying analysis handled automatically by the indicator:
Step 1 — Entering a Trade
Wait for a Yellow Dart warning signal to identify that a trade setup is forming. Then look for a pullback that holds the prior swing high (for short trades) or swing low (for long trades). When a Cyan Dart, Magenta Dart, Green Diamond, or Purple Diamond forms on the pullback, enter the trade. Filtered Diamond signals are stronger than unfiltered Dart signals and may use a wider initial stop. A Pierced Dart or Diamond is a strong stop-and-reverse signal for aggressive traders.
Step 2 — Managing the Position
Set your initial stop at Dash2 when entering on a Diamond signal in a trending market, or at Dash1 for more conservative entries or Dart signals. Monitor the Kaos Ratio — a rising reading indicates increasing choppiness and may warrant tightening stops. As the trade develops and arrow signals begin to appear, progressively tighten from Dash2 to Dash1.
Step 3 — Exiting the Trade
Exit 50–80% of the position when a colored (green or red) arrow appears, indicating a momentum divergence. Tighten the remaining stop to Dash1. When a gray arrow appears, take partial profit and tighten stops to Dash1. A hollow gray arrow is a caution signal — tighten stops but do not necessarily exit. The remainder of the position is managed with the Dash stops.
Rigorous Statistical Foundations. Elegant Simplicity.
KaseX is powered by the same statistical and mathematical principles underlying the full Kase StatWare® suite — enabling it to produce signals that are precise, repeatable, and probability-based rather than reliant on empirical observation or simplistic rules.
The analytical framework embedded within KaseX includes:
- Kase’s serial dependency index — statistically measuring the degree of non-random behavior in market price action
- Volatility-adaptive stop placement using statistical standard deviations of Average True Range
- Self-optimizing cycle length and volatility calculations from the KasePO and KaseCD momentum indicators
- Synthetic longer bar-length computation for embedded multi-timeframe filtering without switching charts
- Automated momentum divergence and overbought/oversold signal detection with statistically defined confirmation thresholds
- Kaos Ratio — a statistical measure of risk variation relative to average risk for market tradability assessment
Kase offers complimentary one-on-one and group lessons and support for all KaseX subscribers — ensuring traders get the most from the indicator from day one.
KaseX is a licensed analytical tool designed to support each trader’s own market decisions. It is not to be construed as investment advice, trading recommendations, or consulting. All trading decisions remain the responsibility of the individual or organization.
Take a Complimentary Trial Today
Experience KaseX for yourself and activate a 30-day complimentary trial on your existing charting platform — at no charge and no obligation.
Available on major charting platforms including: