Natural Gas Forecast: Oscillating Within Bullish Flag

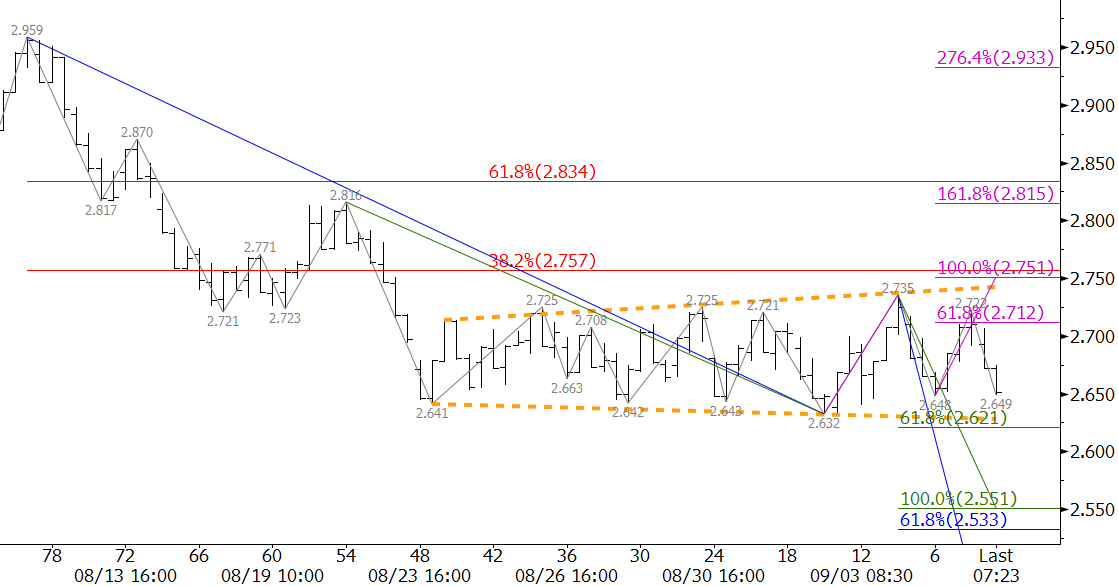
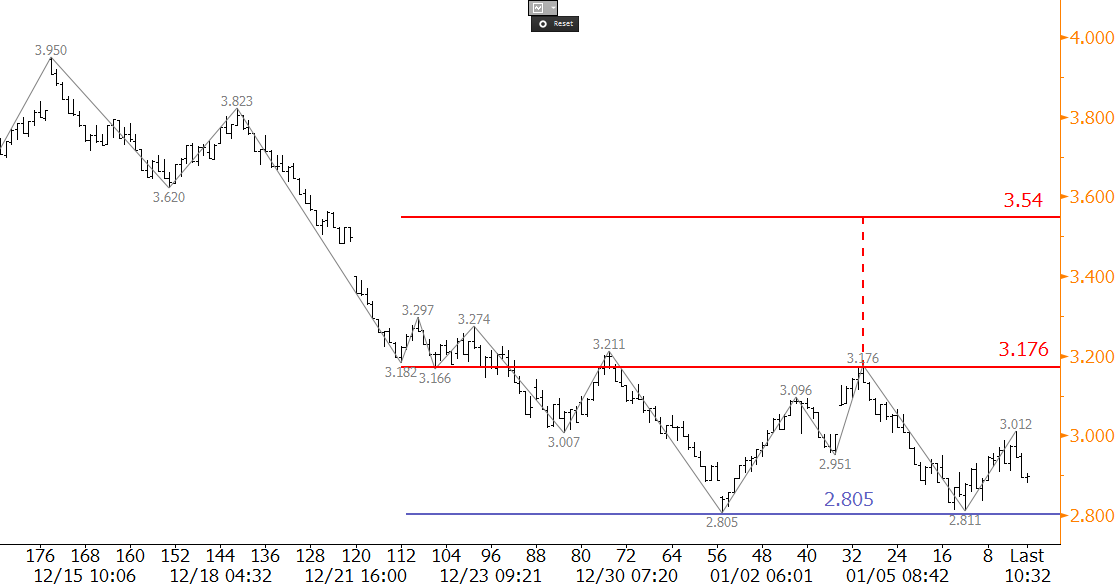
October natural gas looks to be well balanced as it continues to oscillate in a range between nominally $2.88 and $3.03. The range forms a bullish flag after holding support at $2.88 on Monday. However, today’s early move up stalled before it could overcome the $2.998 swing high and challenge the flag’s $3.03 upper trend line.

Flags are generally reliable continuation patterns. However, in this case, we believe there is a high probability that $3.03 will hold and that ultimately prices will break lower out of the pattern. This is because the pattern has been very wide relative to the prior move up from $2.799 to $3.042. In addition, prices have not been able to overcome the psychologically important $3.00 level for the past few days.

NGV17 Kase Bar Chart
NGV17 $0.035 Kase Bar Chart

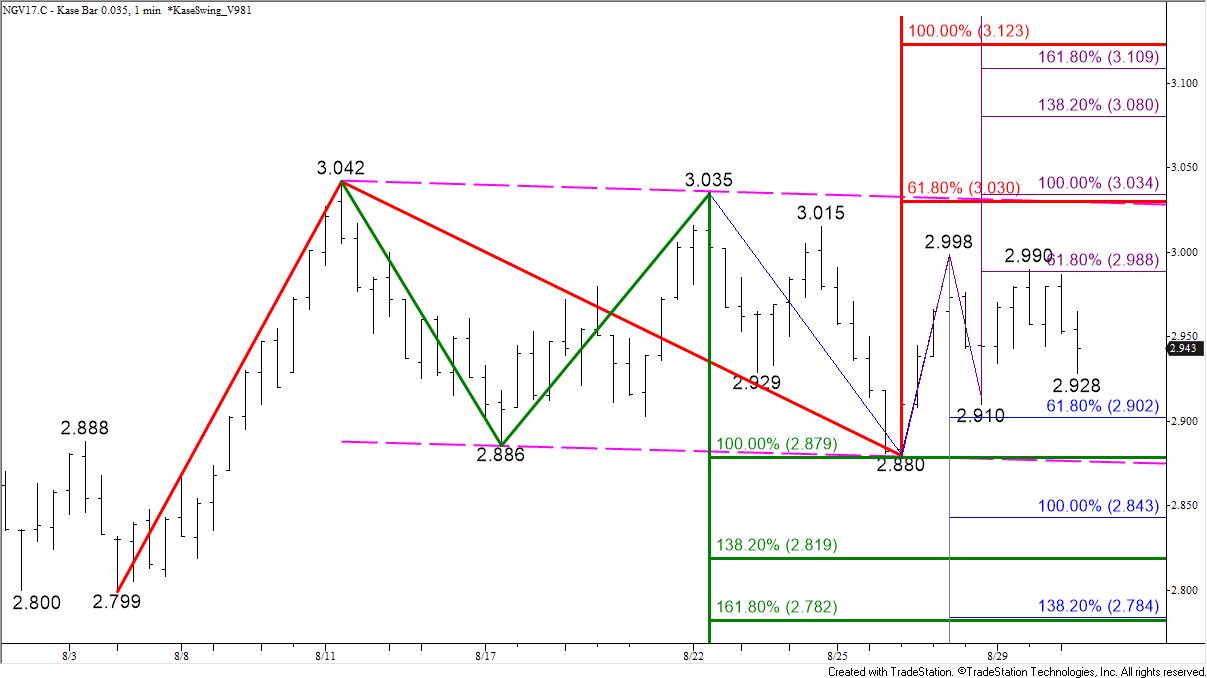
Because the wave $2.88 – 2.998 – 2.91 met its $2.99 smaller than (0.618) projection there is still a reasonable chance for a test of $3.03. However, a move below the $2.91 swing low would wipe out that wave and significantly dampen the odds for $3.03 and higher. Therefore, at this point, a move above either $2.99 or below $2.91 should give us a good idea of the direction for the next few days.

The market remains tight and may continue to oscillate in a narrowing range, but with all factors considered, tomorrow look for a test of $2.90 and possibly $2.87. A close below $2.87 would confirm a break lower out of the flag, opening the way for $2.84 and lower.

Should the $2.91 swing low hold and prices overcome $2.99, near-term odds will shift back in favor of challenging $3.03. A close above $3.03 would confirm a break higher out of the flag and call for $3.08 and ultimately $3.12.

This is a brief analysis for the next day or so. Our weekly Natural Gas Commentary and daily updates are much more detailed and thorough energy price forecasts that cover key natural gas futures contracts, calendar spreads, the UNG ETF, and several electricity contracts. If you are interested in learning more, please sign up for a complimentary four-week trial.

WTI crude oil fell sharply last Thursday after OPEC and other major producers announced an extension to production cuts through March 2018. This was expected by most, and according to media, the decline was due to disappointment that production cuts were not deeper, which many had hoped for.

U.S. shale production remains a concern, though stockpiles fell for a seventh straight week, a fact that many have seemed to overlook. In addition, some are reportedly wondering what OPEC’s plan for an exit strategy to the production cuts will be without flooding the market with supply again.

For now, the extension of the OPEC cuts has become a game of “wait-and-see”. They will undoubtedly have a longer-term impact on prices, but at this point, it is hard to tell how significant the impact will be.

Most technical factors are negative, though it is still a tight call. July WTI made up some ground since falling late last week. However, the formation of a head and shoulders pattern is negative for the near-term outlook. The pattern’s neckline is $48.1, a close below which would open the way for the move down to continue toward its $44.65 target.

July 2017 WTI Crude Oil - 35-Cent Kase Bar Chart
July 2017 WTI Crude Oil – 35-Cent Kase Bar Chart

The connection to $48.1 is made through $49.1 and $48.6, the 0.618 and 1.00 projections of the wave $50.28 – 49.03 – 49.83. Tomorrow, we expect prices to test $49.1 and $48.6. A close below the lower objective would call for $48.1, the 1.382 projection, which is also near the 0.618 projection of the larger wave, $52.0 – 48.18 – 50.28.

That said, should prices rise above $50.3, near-term odds would shift in favor of $51.1 and possibly higher. The $50.3 level is the top of the head and shoulder’s right shoulder and the 0.618 projection of the wave $48.18 – 50.28 – 49.03. The 1.00 projection is $51.1. Therefore, a close above $50.3 would significantly damage the head and shoulders formation and the likelihood of a break below its $48.1 neckline.

This is a brief analysis and outlook for the next day or so. Our weekly Crude Oil Commentary and daily updates are much more detailed and thorough energy price forecasts that cover WTI, Brent, RBOB Gasoline, Diesel, and spreads. If you are interested in learning more, please sign up for a complimentary four-week trial.

By Dean Rogers

Last week’s break higher out of the bullish pennant was positive and the move up extended to meet the 0.618 projection of the wave $38.51 – $50.04 – 43.71. However the move stalled there, formed a bearish evening star and blow-off high, and then proceeded to test $46.4, the 62 percent retracement of the move up from $43.71.

CLX5 20151013

The market is telling us that it needs more time to sort itself out as it awaits more data. We have stated that the move up would likely be a grind higher, and so far that has been the case.

For now, another trading range will likely form between $46.4 and $50.0. Look for resistance at $47.4 and $48.2.

Should prices fall below the $43.71 swing low the outlook will shift back to negative for the longer-term.

This is a brief analysis and outlook for the next day or so. Our weekly Crude Oil Commentary is a much more detailed and thorough energy price forecast. If you are interested, please sign up for a complimentary four week trial.

By Dean Rogers

For the past few weeks each bit of positive crude oil news or fundamental data has seemingly been offset by something negative. As a result, November Brent has settled into a rectangle formation with boundaries between $47.0 and $50.3.

The upper boundary of the rectangle is poised to be challenged after Monday’s move up to $49.87. The pullback at the end of the day indicates another oscillation lower might take place first, but for now, odds still favor a break higher. A close over $50.3 would call for at least $51.7.

Main20151005152653

Conversely, Brent’s move up has already failed once after breaking higher out of a bullish pennant on September 15. Since then the rectangle has formed. Should the rectangle fail, and prices close below $47.0, look for at least $45.3.

This is a brief analysis and outlook for the next day or so. Our weekly Crude Oil Commentary is a much more detailed and thorough energy price forecast. If you are interested, please sign up for a complimentary four week trial.

By Dean Rogers

After the late August rally WTI settled into a narrowing range that forms a pennant. This is a continuation pattern that indicates odds favor a break higher. However, these odds are somewhat dampened due to the price rise that took place before their formation was small in comparison to the size of the formation. In addition, more than half of the price rise has already been eroded.

wti crude oil

The small wave up from $43.71 indicates that a close over $46.0 would call for $47.0, which is in line with the top of the pennant.

We like support at $44.1 to hold, but $43.0, near the 62 percent retracement of the move up, is the key for a negative outlook.

On balance, even if prices break higher or lower out of the pennant, we could see crude oil continue to oscillate in a wider range for another few weeks while the market sorts out fundamental and geopolitical factors.

This is a brief analysis and outlook for the next day or so. Our weekly Crude Oil Commentary is a much more detailed and thorough energy price forecast. If you are interested, please sign up for a complimentary four week trial.

By Dean Rogers

Last week we stated WTI and Brent would likely settled into trading ranges while sorting out longer-term fundamental factors and the late August price surge. That has been the case, and so far the oscillations have formed a flat descending triangle for WTI and a pennant for Brent.

WTI and Brent patterns

Both patterns are bullish, but have a higher than normal probability to fail in our opinion. Even upon a break higher we do not expect a bullish rally to ensue, but rather a test of the recent swing highs.

Should the patterns fail look for major support at $42.6 for WTI and $46.7 for Brent. In other words, we think the trading range will continue to form between approximately $42.6 and $49.0 for WTI and $46.7 and $52.0 for Brent.

This is a brief analysis and outlook for the next day or so. Our weekly Crude Oil Commentary is a much more detailed and thorough energy price forecast. If you are interested, please sign up for a complimentary four week trial.

By Dean Rogers

It is a glorious time of year. The evenings are cooler, the air is a bit crisper, and the seven month void in my soul has been filled. Football season is upon us, and all is right with the world.

I grew up playing football and my father and uncles coached youth football for over 30 years. Being a coach’s son I have always had an appreciation for the tactical side of the game, especially low scoring (some might say boring) defensive struggles. These games are won not only by raw talent, but strategy, patience, and perseverance.

A defensive battle on the gridiron reminds me of the natural gas market right now. From the outside looking in most see a stale and boring game being played. It is a bit like watching grass grow and they have already switched channels to watch a more exciting game. However, there is a battle taking place between bulls and bears and natural gas’s game is nearing the end of the fourth quarter.

My money is still on the bears (hopefully Cutler has been benched).

Natural gas has oscillated in a range that is widening ever so slightly since August 24. The pattern it forms is called an expanding triangle, which is negative because the market entered the formation after falling from $2.959 to $2.641. Expanding triangles form when there is mounting indecision and typically has bearish ramifications.

natural gas

The bulls may attempt one last Hail Mary before all is said and done. Another test of the upper end of the wedge near $2.75 might take place over the next few days, but odds continue to favor a decline to $2.54 and lower once prices break out of the triangle and close below $2.62.

The natural gas game may go into overtime, and it may be another week or more before prices finally break lower. For now though, stick to your strategy, be patient, and persevere.

This is a brief natural gas forecast ahead of tomorrow’s EIA report. Our weekly Natural Gas Commentary is a much more detailed and thorough analysis. If you are interested in learning more, please sign up for a complimentary four week trial.

Perfect geometric formations are a rare commodity. They are useful gems of information that can tell us a lot about a market’s outlook and general direction. It is important to pay attention to the implications of a successful break out of the pattern, and it is even more important to watch for patterns that fail.

WTI’s bearish flag on the $0.50 Kase Bar chart is as close to a textbook example as one will ever see. Flags are extremely reliable continuation patterns. Because this flag formed after a decline, and is sloping upwards, it is a bearish pattern that indicates the move up is corrective and that the decline should continue.

WTI Crude Oil

The waves within the flag have fulfilled the 1.00 projection for the wave $50.58 – 53.43 – 50.91. This is significant because it is evidence that the move up is unfolding as a three-wave ABC pattern, which is more evidence that the move is corrective.

Prices settled in the lower half of the formation on Monday, which does not bode well for another test of the upper trend line. A close below $51.8, which is near the bottom trend line, would indicate the move down is going to extend to at least $49.9. Our detailed weekly analysis discusses the connections to targets in the mid- to low-$40s upon a break lower.

There is an outside chance that the formation will fail, but prices will need to close over $54.8 to prove that an extended upward correction and potential recovery is underway. Technically, the flag will fail upon a close over the upper trend line, which is currently $54.2. However, for many technical reasons, $54.8 is the threshold for a positive near-term outlook. Most importantly, it is near the 38 percent retracement of the decline from $62.22 and the midpoint of July 6th.

For now, watch the flag formation closely. Odds favor a break lower and close below $51.8. The directional breakout of this pattern will be a strong clue as to the direction of WTI for the next several weeks.

This is a brief analysis and outlook for the near-term. Our weekly Crude Oil Commentary is a much more detailed and thorough energy price forecast. If you are interested, please sign up for a complimentary four week trial.

June WTI crude oil has oscillated in the range of a broadening wedge over the last eight trading days. The pattern is bullish, but the euphoria of WTI’s recent price surge is waning. Mixed technical and fundamental factors indicate the pattern will fail if the $58.41 swing high is not overcome soon.

Key technical support for the near term is $55.3 because it is the 1.00 target for the wave down from $58.82, and intersects with the lower trend line of the expanding wedge. This wave stalled at its 0.618 projection of $56.5, so the market is sitting on the teetering edge of a decline to $55.3 or push higher to overcome $58.41. A close over $58.41 would confirm a break higher out of the wedge and would open the way for an extended upward correction. A move below $56.5 would open the way for $55.3 to be challenged. Overall, odds are still slightly in favor of the move up and a break higher out of the wedge, but a close below $55.3 would indicate the pattern has failed.

For more detailed weekly analyses of WTI, Brent, and Natural Gas please take a trial of the Kase Energy Forecasts.

WTI Crude Oil

The outlook for natural gas is negative, and without help from external factors the decline will likely continue. However, the market is hesitant to break support at $2.80 in the near-term, and is likely waiting on tomorrow’s U.S. Energy Information Administration (EIA) Natural Gas Weekly Update before it presses higher or continues to decline.

Several positive technical factors indicate resistance will likely be tested before tomorrow’s EIA report. A small intraday double bottom formed at $2.805, as shown on the 120-minute equivalent Kase Bar chart. The confirmation point for the double bottom is $3.176, which is in line with the 1.00 projection for the wave $2.805 – 3.176 – 2.811. Immediate resistance is $3.04, the 0.618 projection. A move above $3.04 would call for $3.176 to be challenged, and a close over $3.176 would confirm the double bottom. This would then open the way for an extended correction to targets between $3.18 and the double bottom’s $3.54 target (calculation is 3.176 + (3.176 – 2.805) = 3.537). A move of this magnitude will not likely take place without major support from bullish external factors.

NGG

Should $3.176 hold, the move down will likely extend. First support is $2.89, and a close below this would call for a key target at $2.79. This is the 0.618 projection for the wave $3.176 – 2.811 – 3.012. A close below $2.79 would negate the double bottom and open the way for targets in the mid $2s.

Overall, the outlook is negative, and the move down is still favored. However, the double bottom, a daily morning star setup, and deeply oversold conditions, all indicate that a correction may take place very soon, and could be spurred by tomorrow’s EIA report.

Visit the Kase Energy Forecasts Page to sign up for a free trial of Kase’s weekly energy forecasts on natural gas and crude oil.