Kase StatWare®
Statistically Derived Technical Trading Indicators
Kase StatWare® is a complete suite of proprietary, volatility-adaptive trading indicators built on rigorous statistical science — not empirical observation or simplistic math. Covering trade entry, position risk management, and precise exits, StatWare® is compatible with all active stocks, commodities, futures, Forex, and indices.
Built for Any Active Trader or Investor
Kase StatWare® is designed to help traders make better decisions and give fundamental investors insight into the market’s technical structure. It serves a wide range of market participants across every asset class and trading style:
Commodity Traders
Statistically grounded entry, stop, and exit signals for energy, metals, agricultural, and livestock futures.
Equity & Index Traders
Volatility-adaptive indicators that work across all liquid and active stocks, ETFs, and equity index futures.
Forex Traders
Self-optimizing momentum and stop indicators that adapt to the unique volatility characteristics of currency markets.
Hedge Fund Analysts
Rigorous, repeatable technical signals to complement quantitative and fundamental research across a multi-asset portfolio.
Fundamental Investors
Visibility into the market’s technical structure to identify optimal points to increase, decrease, or exit positions.
Independent & Private Traders
Professional-grade statistical indicators available at an individual trader subscription rate across all supported platforms.
More Than Indicators. A Complete Decision Framework.
Where many traditional indicators are based on empirical observations and simplistic math, Kase StatWare® studies are derived from the market’s natural structure and refined by rigorous statistical testing. The result is a unified suite of tools that addresses the three core tasks of trading — entry, risk management, and exit — with statistically validated precision.
Trading success depends on getting these three things right. Kase StatWare® addresses all three with a color-coded system designed to condense complex analytical signals into clean, actionable displays. Whether you are an active short-term trader or a longer-term investor, the system adapts automatically to your bar length and market — self-optimizing both cycle length and volatility parameters without manual tuning.
Kase StatWare® is compatible with all bar types — time-based, tick, volume, and Kase or other range bars — and works across every liquid market.
Kase StatWare® Overview
Watch this six-minute overview to see Kase StatWare® in action — covering how the entry signals, momentum indicators, and DevStops work together as a complete trading system.
The Four Core Studies
Kase StatWare® is comprised of four core studies and several supplementary studies. The core studies work together as a complete system covering the entire trade lifecycle from entry through exit:
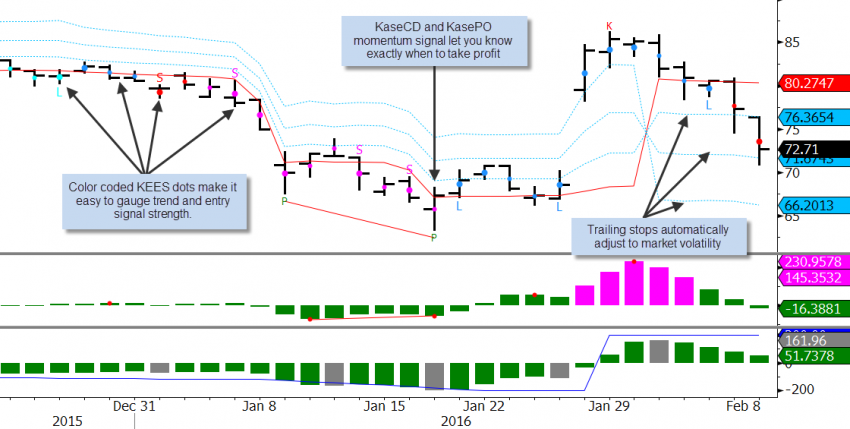
Kase StatWare® — KEES entry signals and Kase DevStop trailing stops (top panel), KaseCD momentum (middle), and KasePO momentum (bottom)
Kase Easy Entry System (KEES)
KEES is the trade entry core of Kase StatWare®. It takes a range of signals based on swings, momentum crossovers, bar patterns, and a higher bar-length filter, and then condenses them into an easy-to-use system of color-coded dots that reflect directional strength and color-coded “L” for long and “S” for short entry signal triggers.
KEES signal color guide:
- Green “L” — long setup or aggressive entry signal
- Blue dots and “L” — first-class long permission and entry signal
- Cyan dots and “L” — second-class long permission and entry signal
- Orange “S” — short setup or aggressive entry signal
- Magenta dots and “S” — first-class short permission and entry signal
- Red dots and “S” — second-class short permission and entry signal
Kase DevStops
The DevStops are Kase’s proprietary trailing stop system. Unlike percentage-based or fixed-point stops, DevStops evaluate not only average market range but the distribution and variability of that range. Stops are set at points of statistically increasing probability that a reversal against the trend is significant.
Three graduated stop levels provide a framework for scaling out of positions as the trade matures:
- Dev3 — wide stop for trend following
- Dev2 — moderate stop for standard position management
- Dev1 — tight stop used after strong exit or warning signals
- All levels adapt dynamically to current market volatility
KasePO — Kase Peak Oscillator
The KasePO is a first-derivative momentum indicator measuring the rate of change of price. Based on Kase’s serial dependency index, it statistically measures the degree of non-random market behavior and self-optimizes both cycle length and volatility. KasePO is typically used to identify optimal trade exit points using momentum divergence and overbought/oversold signals called PeakOuts. The divergence and PeakOut signals are automatically identified and marked on the chart.
KasePO signal guide:
- Green divergence line — strong exit signal, typically exit 80% and tighten stop to Dev1
- Dashed green divergence line — weak exit signal, tighten stop to Dev1
- Green PeakOut “P” — strong overbought or oversold signal, typically exit 50% and tighten stop to Dev1
- Gray PeakOut “P” — weak overbought or oversold signal, tighten stop to Dev1
KaseCD — Kase Convergence/Divergence
The KaseCD is the second-derivative complement to KasePO, measuring the rate of change of the KasePO itself. This makes the KaseCD a faster-moving momentum oscillator and is more sensitive to market moves. KaseCD is typically used to identify optimal trade exit points using momentum divergence and overbought/oversold signals called KCDpeaks. The divergence and KCDpeak signals are automatically identified and marked on the chart.
KaseCD signal guide:
- Red divergence line — strong exit signal, typically exit 80% and tighten stop to Dev1
- Dashed red divergence line — weak exit signal, tighten stop to Dev1
- Red KCDpeak “K” — strong overbought or oversold signal, typically exit 50% and tighten stop to Dev1
- Gray KCDpeak “K” — weak overbought or oversold signal, tighten stop to Dev1
Built for Precision. Designed for Decision-Making.
Every Kase StatWare® study is engineered around statistical principles that give traders a demonstrable, measurable edge over traditional indicator approaches:
Color-Coded Entry System
KEES condenses swings, momentum crossovers, bar patterns, and a higher bar-length filter into a single color-coded display with precise long and short entry signals.
Volatility-Adaptive Stops
DevStops use standard deviations of Average True Range — adapting to actual market volatility rather than fixed thresholds or price percentages.
Self-Optimizing Parameters
KasePO and KaseCD self-optimize both cycle length and volatility, adapting to current market conditions without manual parameter tuning or optimization.
Automated Divergence Detection
The Kase momentum divergence algorithm embedded in KasePO and KaseCD automatically identifies and displays confirmed divergences — no manual scanning required.
Precise Overbought and Oversold Signals
The KasePO and KaseCD identify overbought and oversold conditions and also automatically displays precise overbought and oversold signals.
Fully Compatible with Custom Trading Systems
All Kase StatWare® indicator values and signals are accessible within your charting platform’s native development environment — enabling traders to build, automate, and backtest their own strategies using StatWare® outputs as inputs.
A Simple Three-Step Trading Process
Once the four core studies are on your chart, Kase StatWare® guides you through a disciplined, repeatable process for every trade. The indicators are systematic — not mechanical — giving traders the structure they need while preserving room for discretion:
Step 1 — Entering a Trade
Entries are signaled by KEES on your primary trading chart. Look for a blue or cyan “L” signal for long trades or a magenta or red “S” signal for short trades. Kase’s approach is to wait for a confirmed signal after a green “L” or orange “S” warning signal and a valid pullback that holds the prior swing high or low. This confirms the impulse move before committing capital. Warning signals may also be used at a trader’s discretion for more aggressive entries.
Step 2 — Managing the Position
Place DevStops immediately upon entry, starting at Dev3. As the trade develops and momentum indicators begin to show warning signals, progressively tighten from Dev3 to Dev2. Dev1 is used after a partial exit is taken or a weak exit signal is triggered.
Step 3 — Exiting the Trade
Exit 80% of the position when a KasePO or KaseCD divergence forms and tighten the stop to Dev1. When both KasePO and KaseCD divergences are present together, this represents a 100% exit signal.
Exit 50% of the position when an overbought or oversold KasePO “P” or KaseCD “K” signal and tighten the stop to Dev1.
Tighten the stop to Dev1 when a weak divergence, overbought, or oversold signal is triggered.
Generally, when an exit signal in the form of a momentum divergence or an overbought or oversold signal forms, a trade is partially exited, and the stop is tightened to Dev1 for the remainder of the trade. The DevStop framework ensures that if the exit signal proves premature, the remaining position is protected while leaving room for the trade to continue.
Supplementary Studies — Built Into the StatWare Indicator Package
In addition to the four core studies, Kase StatWare® includes several supplementary studies, some of which are embedded within the core indicators but may also be added to charts independently for additional analytical depth:
Kase Permission Stochastic
Computes a synthetic longer bar-length Stochastic that updates on each underlying bar. This indicator enables higher-timeframe trend filtering without waiting for longer bars to complete. PermK and PermD lines are embedded in KEES to classify first and second-class long and short permissions.
Kase Permission Function
Displays the underlying long/short permission of the Kase Permission Stochastic as a color-coded histogram — green when long trades may be taken and dark magenta when short trades are permitted.
Kase Reversal Amounts
Plots the absolute dollar and cent value of each DevStop level — the actual reversal amount required to trigger each stop. Useful for selecting appropriate bar lengths based on individual risk tolerance and position size and in automated trading systems.
Kase Swing
Identifies and plots swing high and low points on the chart. Embedded in nearly every core study. Adjustable sensitivity for varying market conditions. Also used for wave formation and geometric chart pattern analysis.
Kase Candlestick Patterns
Automatically identifies and plots classical and proprietary candlestick reversal patterns on the price chart. Patterns are filtered by the Stochastic so only those forming under overbought or oversold conditions are displayed — eliminating mid-trend noise.
Kase Trend
Uses Kase Reversal Amounts to identify trend direction and strength. Green below price indicates a bullish trend, red above price a bearish trend, with light green and magenta showing weakening conditions, and gray indicating neutral.
Rigorous Statistical Foundations. Since 1992.
Every Kase StatWare® study is derived from the same statistical rigor that underlies Kase and Company’s market commentary and hedging frameworks — not simplified heuristics or trial-and-error parameter optimization.
The statistical foundations embedded across the indicator suite include:
- Kase’s serial dependency index — statistically measuring the degree of non-random behavior in market price action
- Statistical standard deviations of Average True Range for volatility-adaptive, statistically significant stop placement
- Self-optimizing cycle length and volatility calculations embedded in the KasePO and KaseCD momentum indicators
- Synthetic longer bar-length computation for multi-timeframe filtering without waiting for bar close
- Automated momentum divergence algorithm with statistically defined completion and confirmation thresholds
Kase StatWare® is a licensed analytical tool designed to support each trader’s own market decisions. It is not to be construed as investment advice, trading recommendations, or consulting. All trading decisions remain the responsibility of the individual or organization.
Take a Complimentary Trial Today
Experience Kase StatWare® for yourself and activate a complimentary trial on your existing charting platform — at no charge and no obligation.
Available on all major charting platforms: