LME Copper Technical Analysis and Near-Term Outlook
This is a brief analysis for the next day or so. Our weekly Metals Commentary and daily updates are detailed and thorough price forecasts that cover key COMEX precious metals futures contracts and LME Non-Ferrous (Base) metals, spot gold, the gold/silver ratio, and metals ETFs. If you are interested in learning more, please sign up for a complimentary four-week trial.
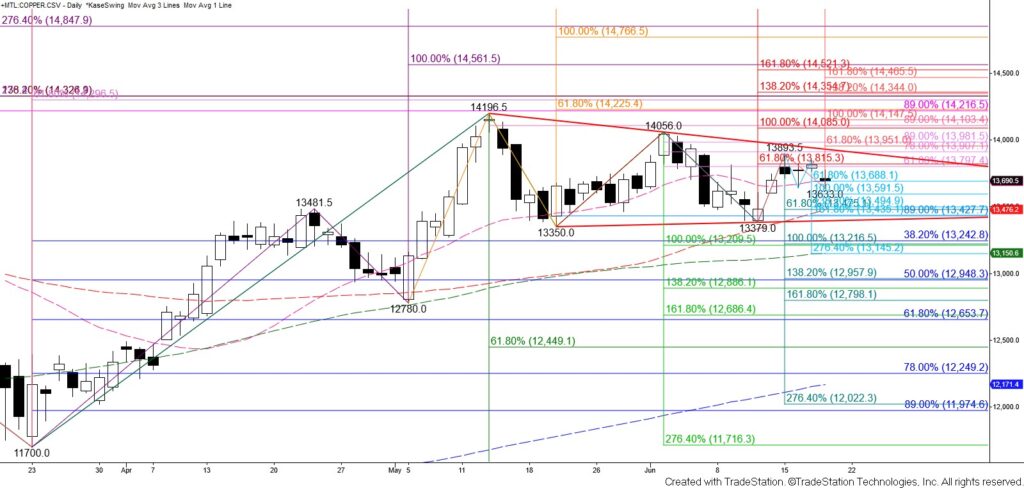
LME copper continues to show indecisiveness, trading within the range of a potential symmetrical triangle (one could argue it is a flat descending triangle). A second touch of the upper trendline, which will be around $13910 tomorrow, is still necessary to form the triangle. However, today’s small decline suggests that copper may fail to touch the upper trendline. Prices settled marginally above the respective $13688 smaller than (0.618) target of the wave down from $13893.5 and the 20-day moving average at $13689. Although $13688 held on a closing basis, the odds lean in favor of testing this wave’s $13596 equal to (1.00) target and possibly the key $13475 smaller than target of the wave down from $14056 within the next day or so. Closing below $13475 will open the way for the $13228 equal to target of the waves down from $14196.5 and $14056.
Nonetheless, this is a tight call because holding $13688 warns that another attempt to close above the $13815 smaller than target of the wave up from $13350 might occur first. Settling above this will call for a push to test the upper trendline of the potential triangle and possibly the $13951 smaller than target of the wave up from $13379. Settling above $13951 will confirm a breakout and put the odds firmly in favor of $14105 and higher.