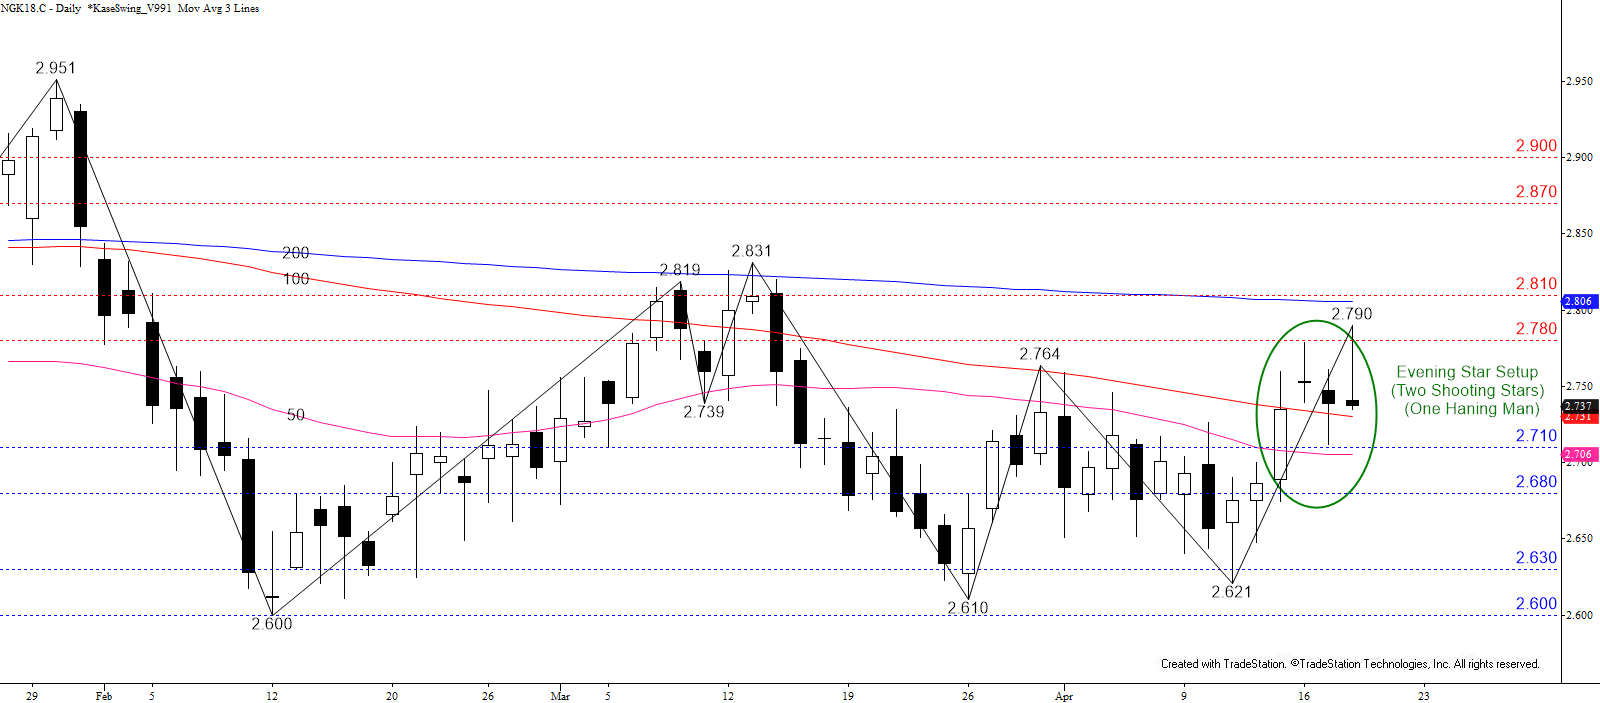
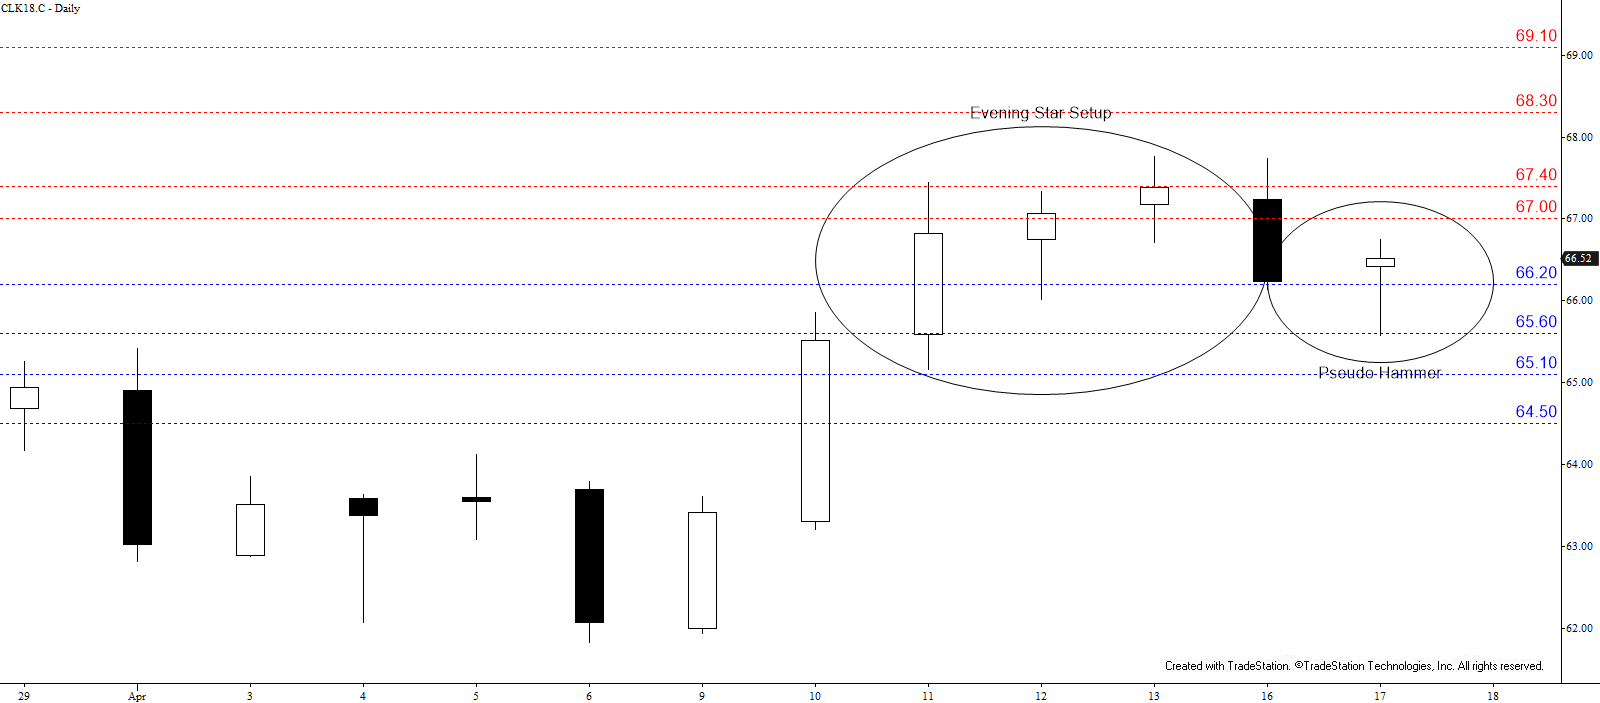
June WTI crude oil failed to rise above the $69.55 swing high today after stalling at $69.38. The subsequent move down formed a bearish engulfing line and challenged the $67.6 completion point of the daily evening star and hanging man bearish reversal pattern that has been set up since April 19.
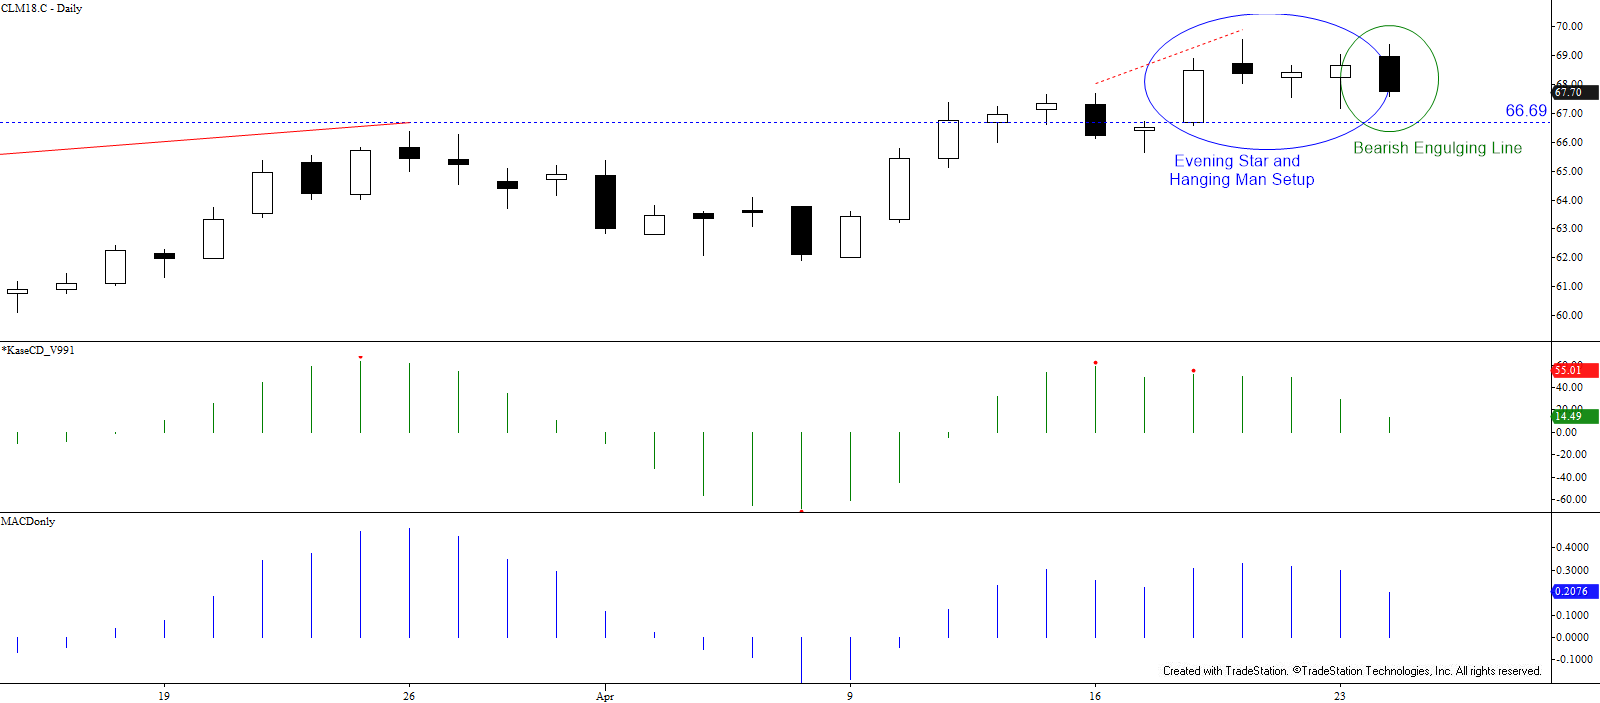
A weak bearish KaseCD and MACD divergence indicate the move down is most likely corrective but the move down is poised to extend to at least $67.1 and possibly $66.6 tomorrow. A close below the latter would confirm the evening star and hanging man and take out the 38 percent retracement of the move up from $61.86, opening the way for a larger correction before the move up continues.
After such an aggressive pullback, it is not uncommon to see a test of resistance overnight. Therefore, today’s $68.3 midpoint might be tested but should hold. Tomorrow’s key resistance level is $69.0, a close above which would wipe out the bearish engulfing line and negate the evening star and hammer pattern. This would, in turn, open the way for a test of resistance split around $70.0 at $69.8 and $70.2. Of these levels, $70.2 is most important.
This is a brief analysis for the next day or so. Our weekly Crude Oil Forecast and daily updates are much more detailed and thorough energy price forecasts that cover WTI, Brent, RBOB Gasoline, Diesel, and spreads. If you are interested in learning more, please sign up for a complimentary four-week trial.