WTI Crude Oil
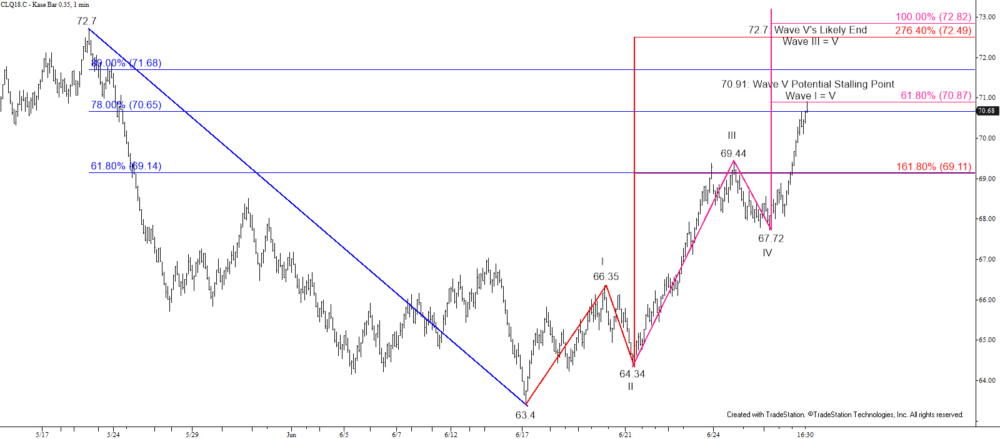
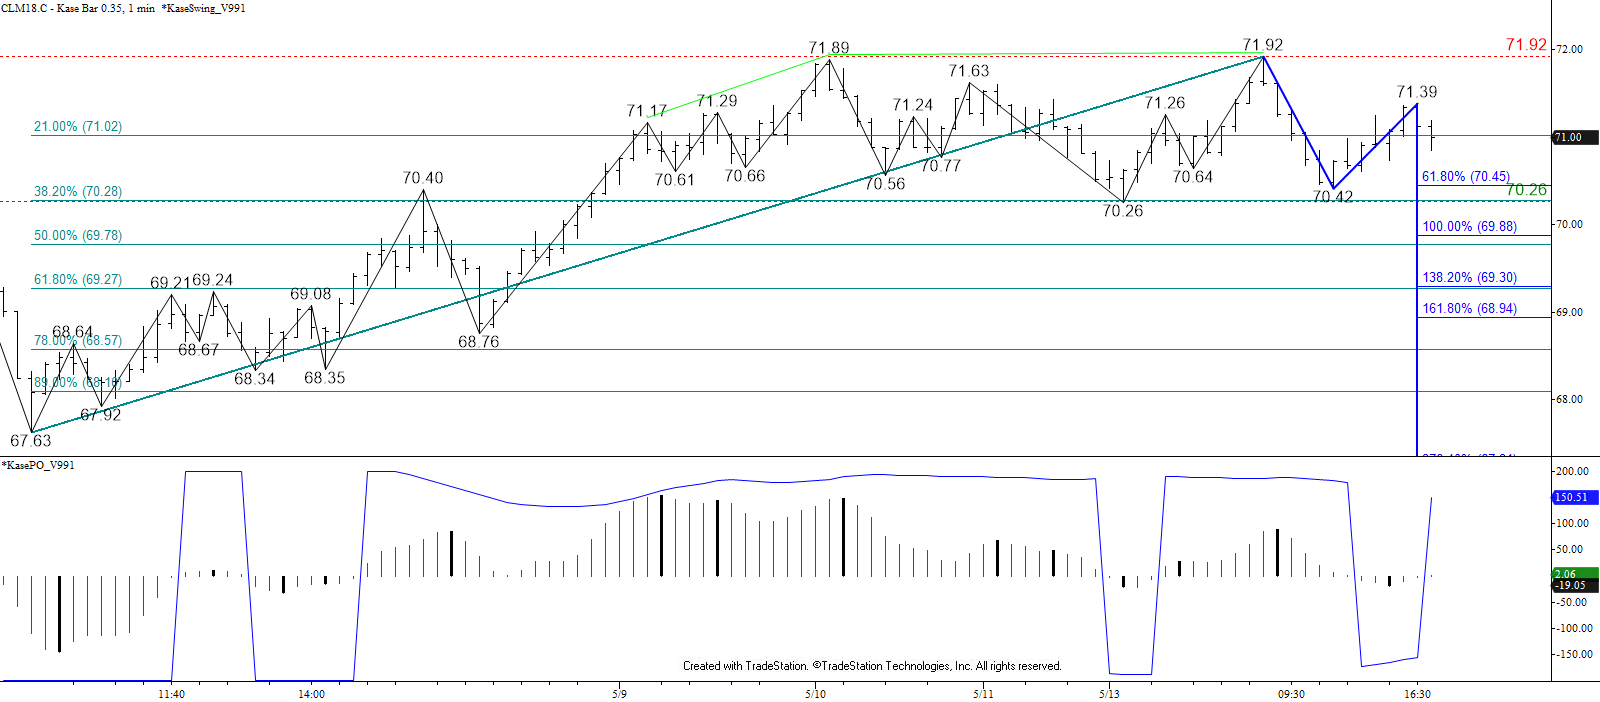
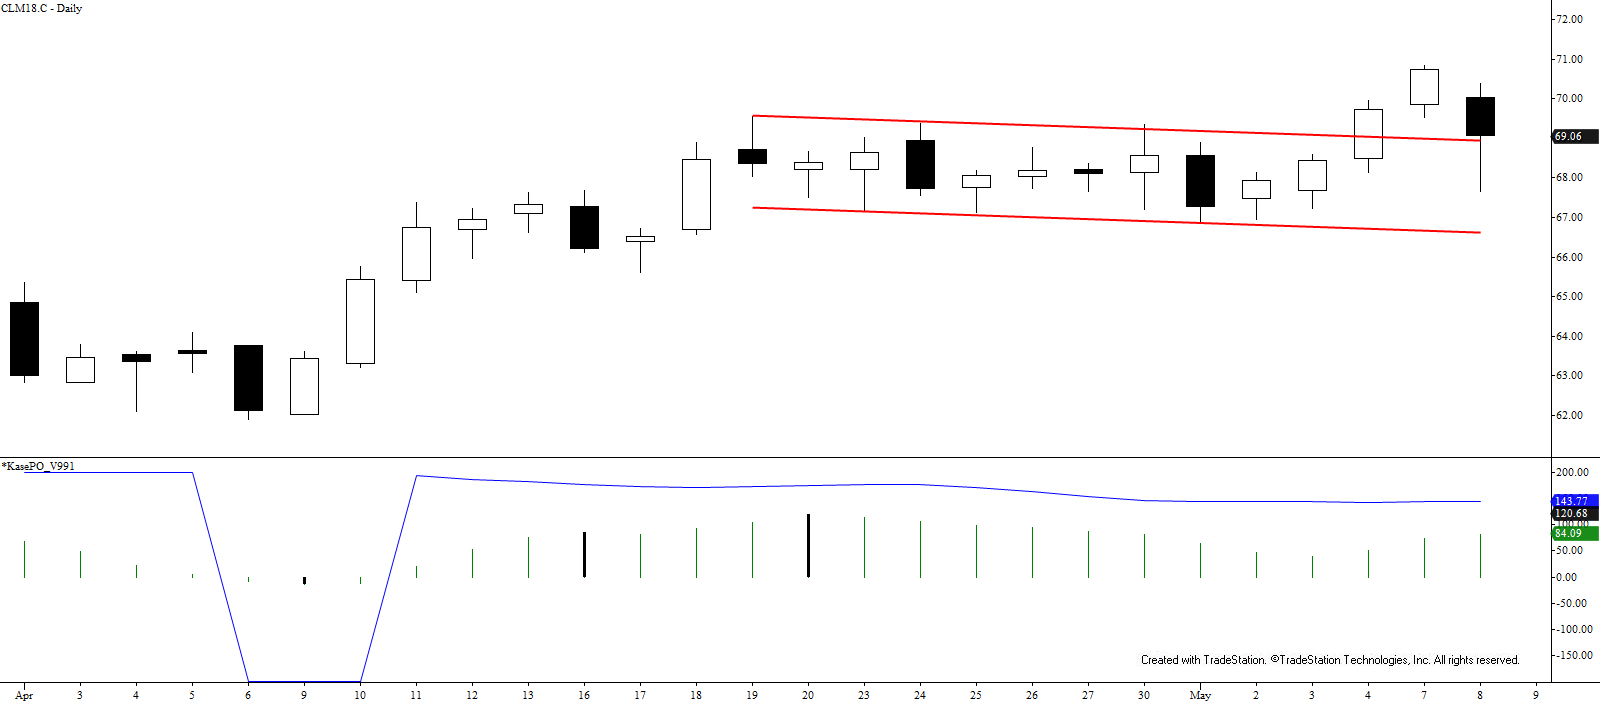
WTI held the 62 percent retracement of the decline from $72.98 and subsequently broke lower out of an intra-day bearish flag. The 50-day moving average at $68.22 was tested and held on a closing basis, but the break lower out of the flag and the wave down from $70.43 call for $68.0 tomorrow. This is an important objective because it is the 62 percent retracement of the rise from $66.29. Settling below this would be a strong indication the recent move up is over and that prices will challenge support around the $66.29 swing low over the next few days.
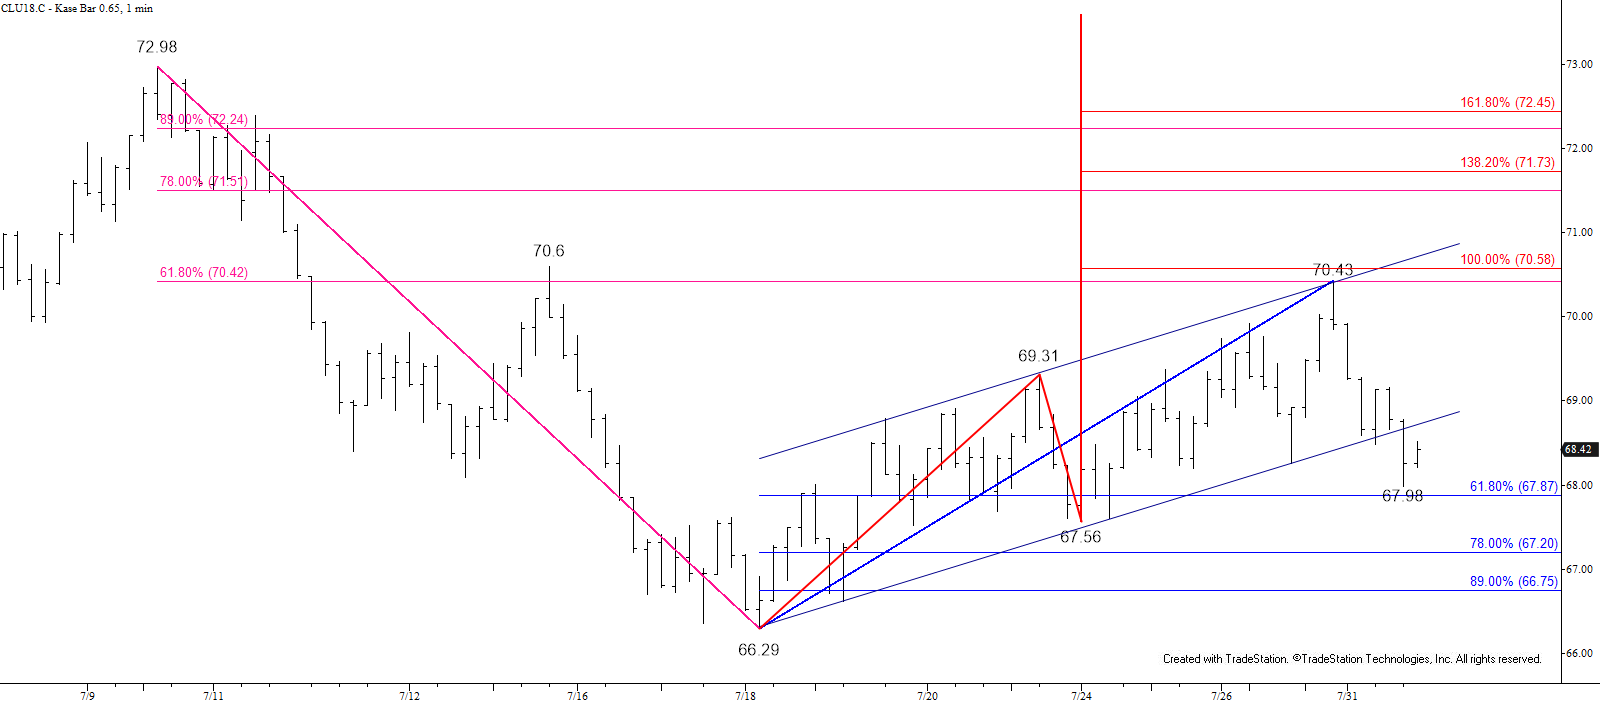
For now, resistance at $69.4 should hold. However, to regain a bullish near-term outlook WTI must settle above $70.6, which would then open the way for $71.5 and higher. This is doubtful given the break lower out of the bearish flag and will become must less probable upon a close below $68.0.
Brent Crude Oil
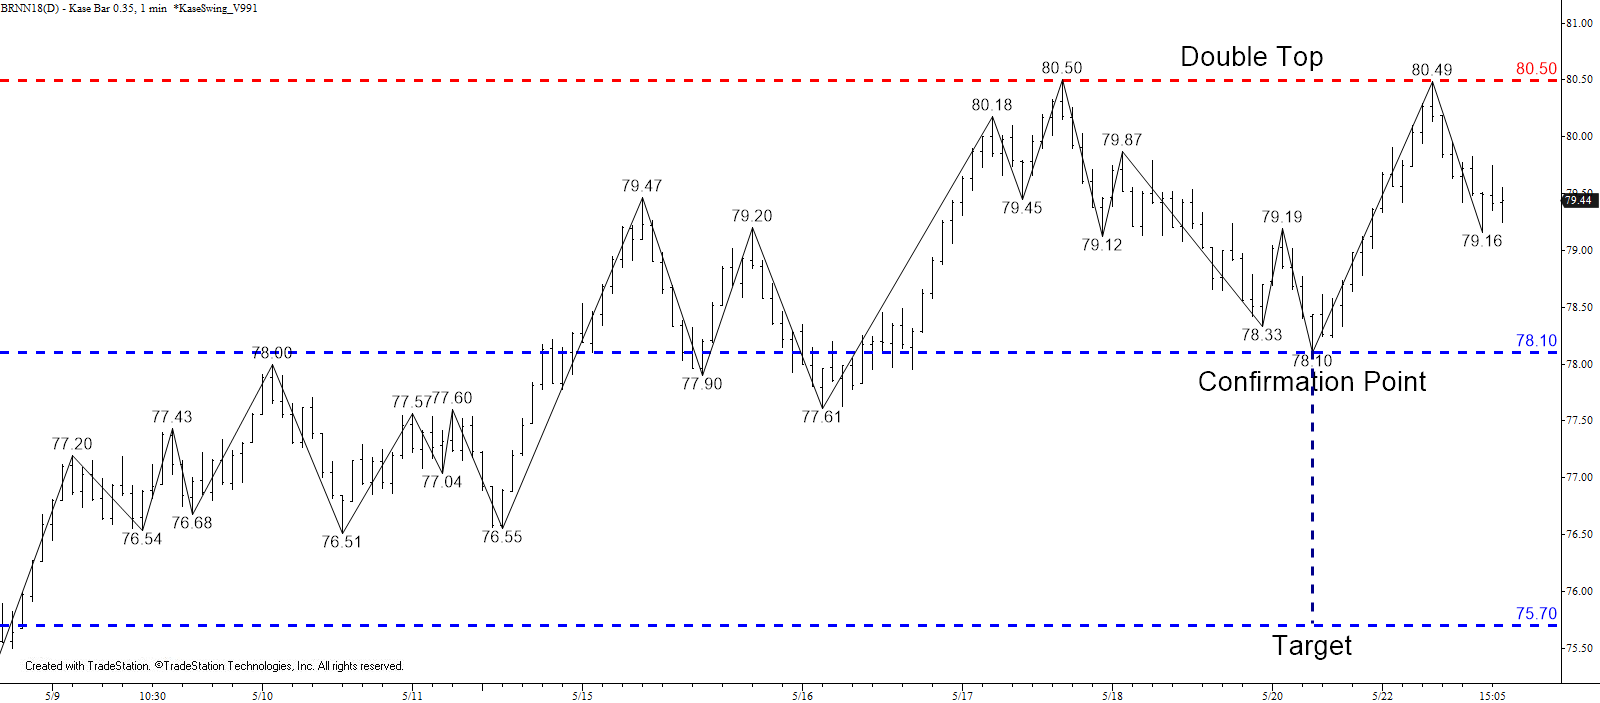
Brent settled back below the 50-day moving average today and the move down from yesterday’s $75.79 swing high accelerated. Prices are now poised to challenge at least $73.7 and $73.0 within the next day or so. The latter is key for the near-term outlook because it is the 62 percent retracement of the move up from $71.3. A close below this would be a strong indication the recent move up is over and would open the way for $72.0, $71.1, and lower.
Today’s $74.9 midpoint should hold upon a test of resistance. Key resistance and the barrier for a more positive near-term outlook again is $76.6. A move above this is unlikely though unless support at $73.0 holds, which is currently looking doubtful.
This is a brief analysis for the next day or so. Our weekly Crude Oil Forecast and daily updates are much more detailed and thorough energy price forecasts that cover WTI, Brent, RBOB Gasoline, Diesel, and spreads. If you are interested in learning more, please sign up for a complimentary four-week trial.