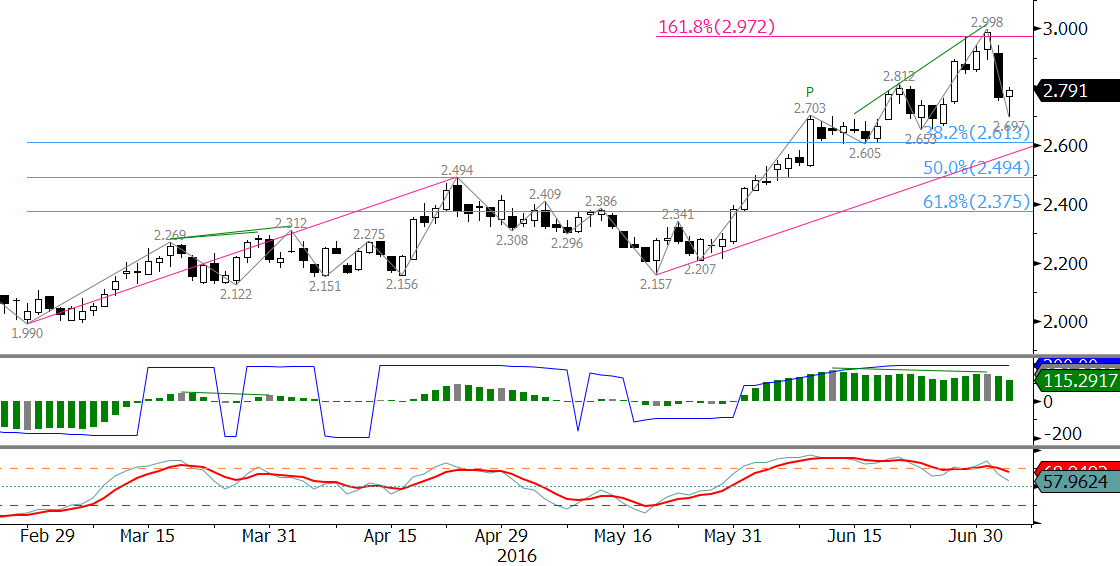
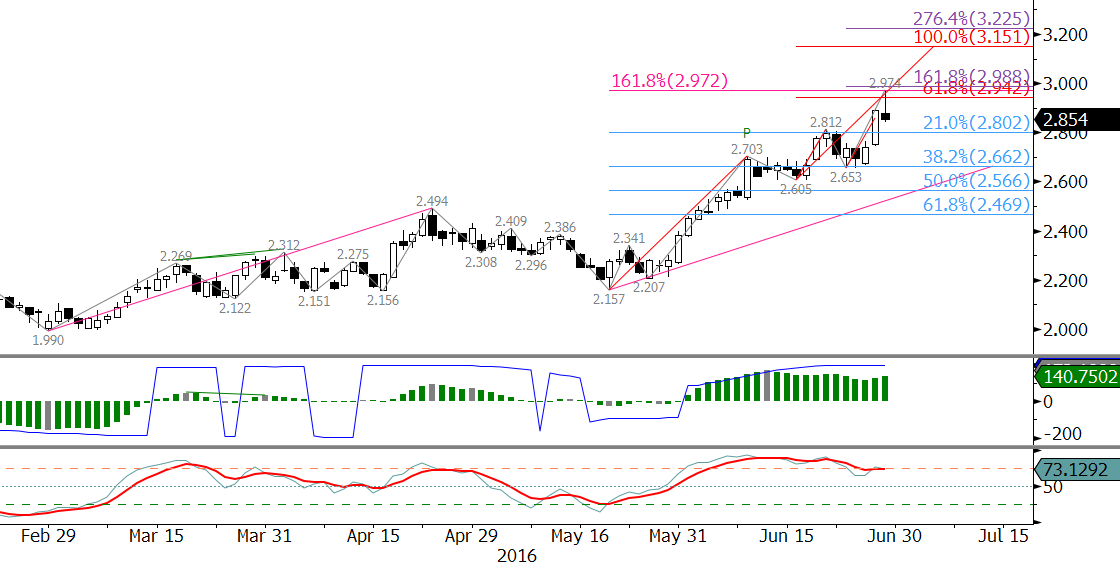
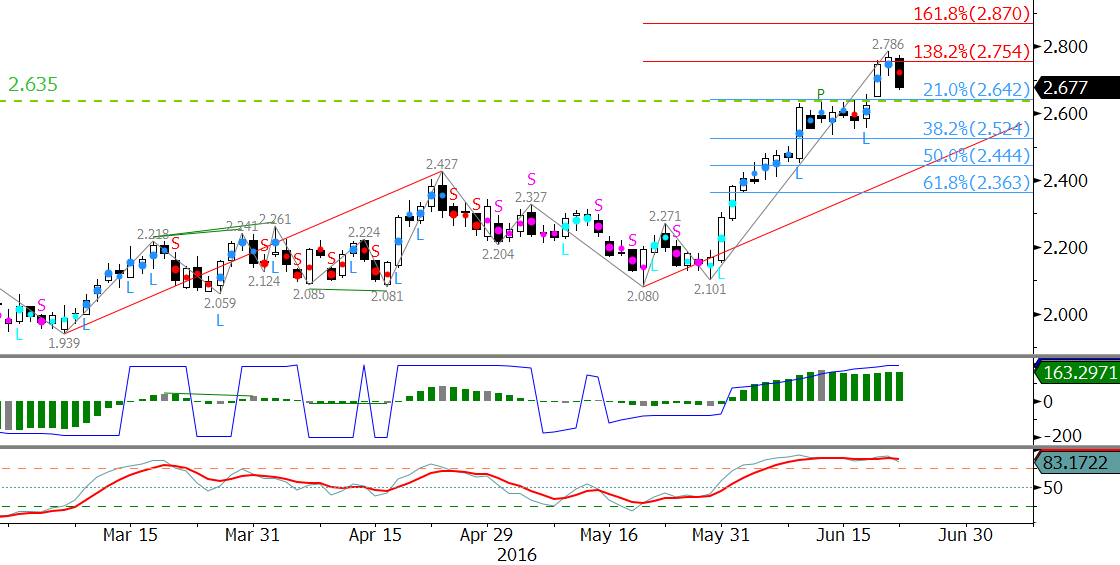
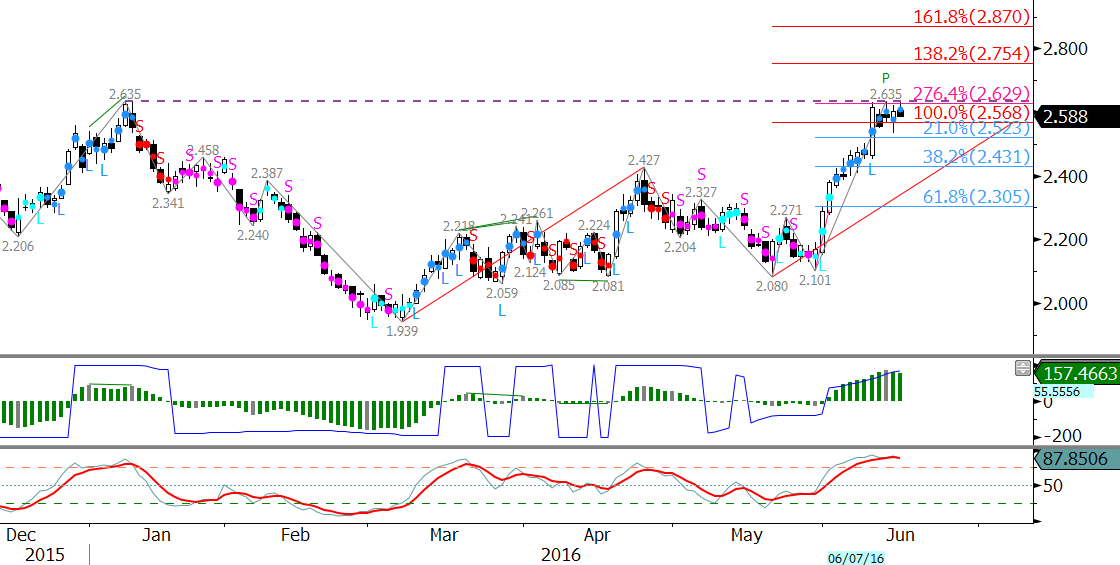
September natural gas is trying to break higher out of the month long trading range. Two important boundaries have been established within the range. First between $2.71 and $2.84. Second between $2.66 and $2.96. Prices rose above $2.84 in early trading Wednesday, but closed just below at $2.839. Nonetheless, prices will likely push for at least $2.91 and possibly $2.96 tomorrow. A close over $2.96 would call for the bullish trend to extend to targets above $3.00. Given the strength of the moves up today and last Thursday, it looks as though prices will rise to new recovery highs soon.
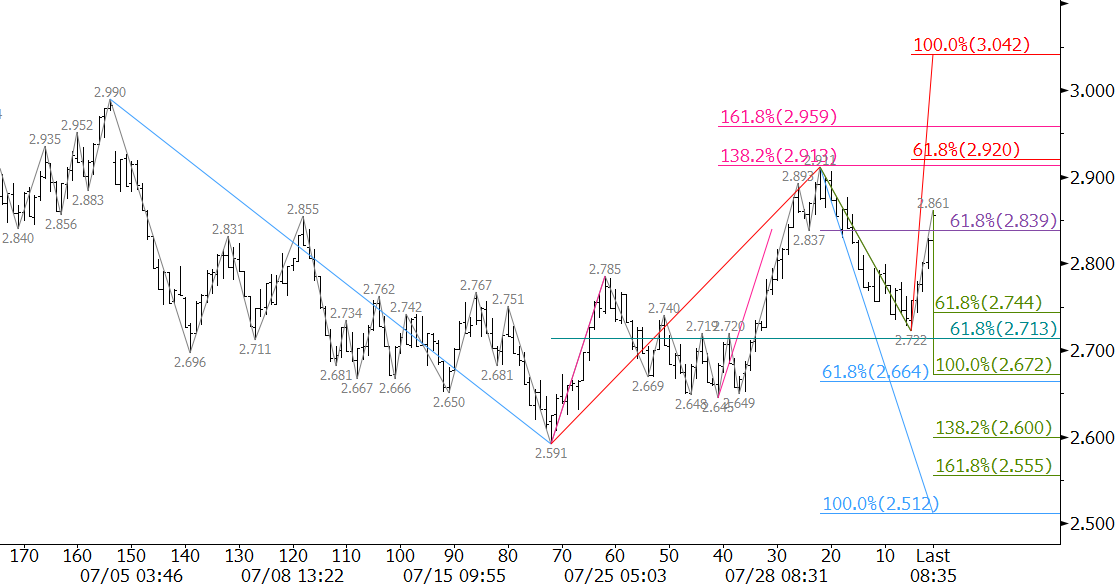
That said, a break higher out of the range in the near-term will likely hinge on tomorrow’s EIA Natural Gas Storage Report. A larger than expected build (some are looking for a draw in tomorrow’s report) could open the way for another test of $2.71. A close below this would then call for key support at $2.66.
With all technical factors considered, odds favor the move up tomorrow. September will need to close over $2.91 to keep the momentum it gained today and then close over $2.96 soon to open the way for targets above $3.00.
This is a brief natural gas forecast for the next day or so. Our weekly Natural Gas Commentary and intraweek updates provide a much more detailed and thorough analysis. If you are interested in learning more, please sign up for a complimentary four-week trial.