Brent Crude Oil Technical Analysis and Short-Term Forecast
This is a brief analysis for the next day or so. Our weekly Crude Oil Forecast is a much more detailed and thorough energy price forecasts that cover WTI, Brent, RBOB Gasoline, Diesel, and spreads. Daily updates are included. If you are interested in learning more, please sign up for a complimentary four-week trial.
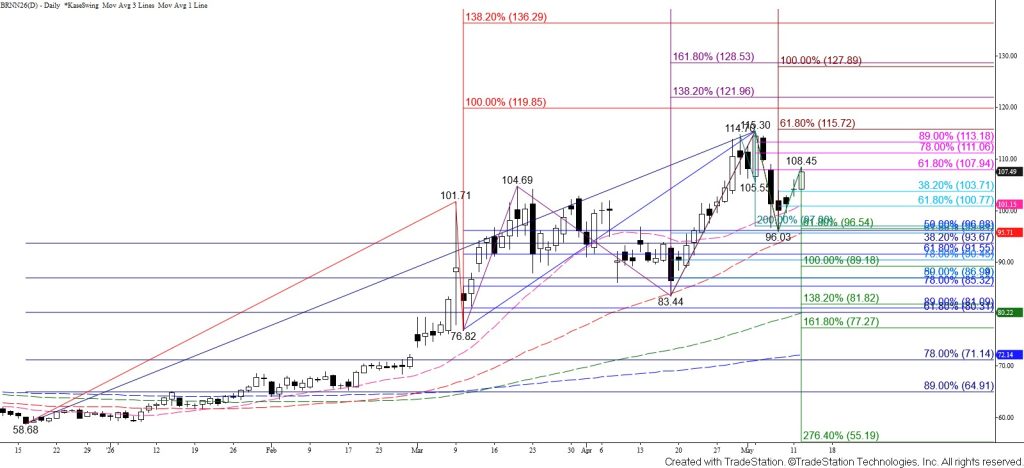
July Brent crude oil has continued to work its way higher after fulfilling and holding the $97.0 target of a confirmed $115.0 double top, the 50 percent retracement from $76.82, the 62 percent retracement from $83.44, and the 20-day moving average on a closing basis last week. Prices settled above the equal to (1.00) projection of the intraday wave up from $96.03 today, but also held the 62 percent retracement from $115.30 at $107.9 on a closing basis. This is a potential stalling point, and the 10-day DMI and ADX continue to reflect a neutral range. Even so, there are no bearish patterns or signals that call for the move up to stall. Additionally, settling above the $107.4 equal to target of the wave up from $96.03 indicates that a test of this wave’s $110.7 intermediate (1.382) target and possibly the $112.5 larger than (1.618) target will occur within the next few days. Settling above $112.5 will call for a test of the $115.7 smaller than (0.618) target of the wave up from $83.44, a close above which will confirm a continued rise for July Brent crude oil.
Nevertheless, because the 62 percent retracement from $115.30 at $107.9 held on a closing basis, there is still a modest chance for a deeper test of support or for prices to at least consolidate. However, prices must settle below the 62 percent retracement of the rise from $96.03 and the 20-day moving average around $101.0 to put the near-term odds in favor of challenging a bearish decision point at $96.5. The $96.5 level is the smaller than target of the current wave down from $115.30 and will be in line with the crucial 50-day moving average within the next few days.