Gold Technical Analysis and Near-Term Outlook
This is a brief analysis for the next day or so. Our weekly Metals Commentary and daily updates are much more detailed and thorough energy price forecasts that cover key COMEX precious metals futures contracts and LME Non-Ferrous (Base) metals, spot gold, the gold/silver ratio, and gold ETFs. If you are interested in learning more, please sign up for a complimentary four-week trial.
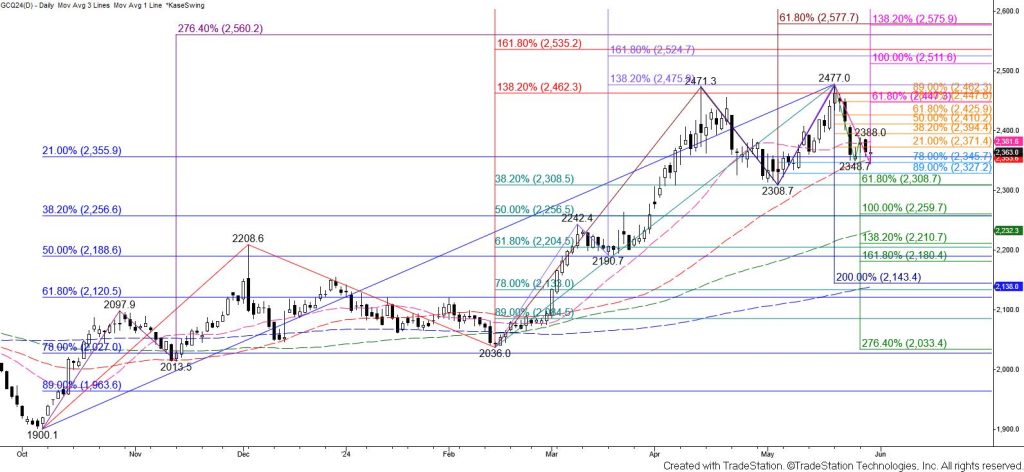
August gold is struggling to take out support around $2346 and today’s doji warns that the move down from $2477 may be complete. However, a double top around $2474, last week’s bearish engulfing line, confirmed daily bearish KasePO, KaseCD, RSI, Stochastic, and MACD divergences, and a sustained close below the 62 percent retracement of the rise from $2308.7 imply a deeper test of support should still take place. Closing below $2346 will call for $2329 and then a test of the $2309 smaller than (0.618) target of the largest wave down from $2477.
Nevertheless, the move down has been lackluster after last week’s decline from $2477. One could also make a case for a double bottom around $2347. Should prices rise tomorrow and overcome the 38 percent retracement of the decline from $2477 at $2394 look for a test of $2410 and possibly key resistance at $2426. This is the 62 percent retracement of the decline from $2477. Therefore, settling above $2426 would strongly imply that the move down from $2477 is a completed correction of the long-term uptrend.