Gold Technical Analysis and Near-Term Outlook
This is a brief analysis for the next day or so. Our weekly Metals Commentary and daily updates are much more detailed and thorough energy price forecasts that cover key COMEX precious metals futures contracts and LME Non-Ferrous (Base) metals, spot gold, the gold/silver ratio, and gold ETFs. If you are interested in learning more, please sign up for a complimentary four-week trial.
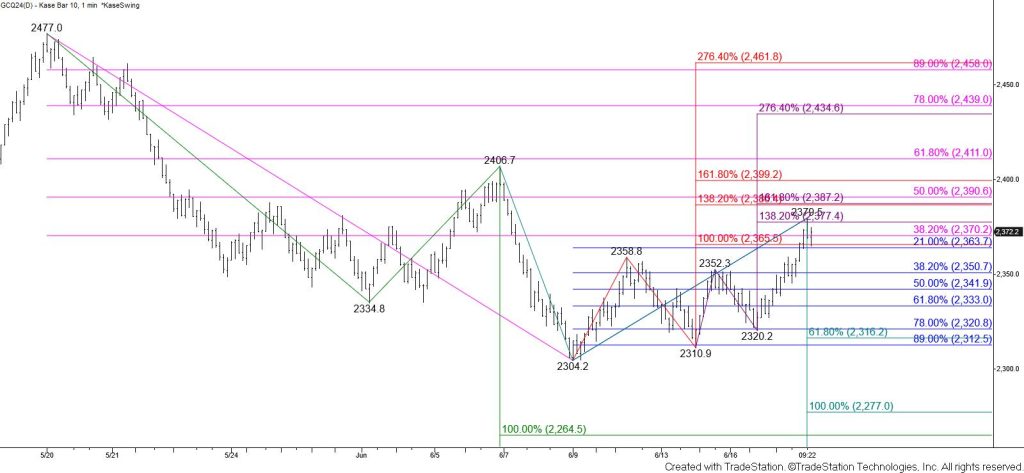
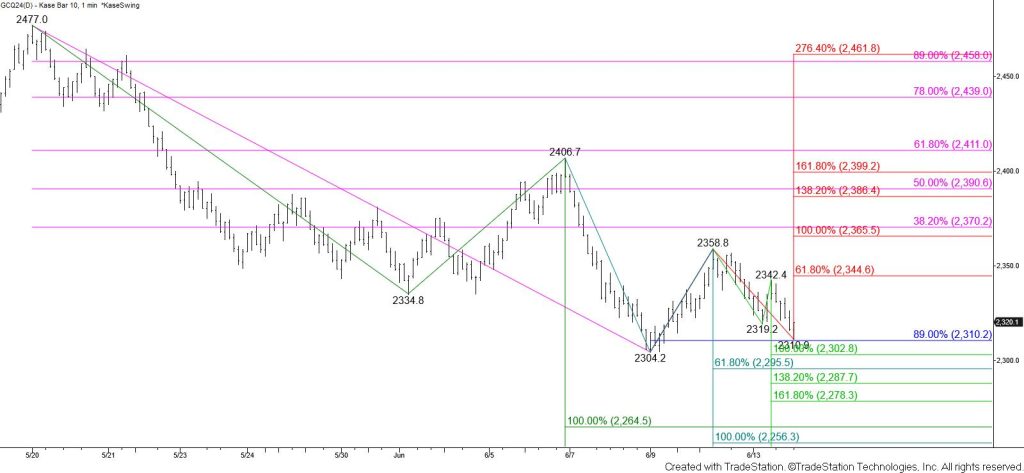
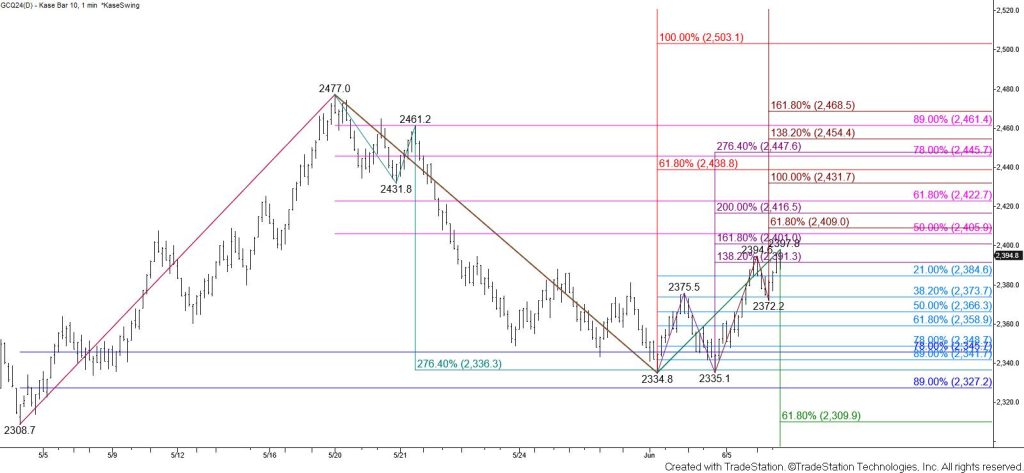
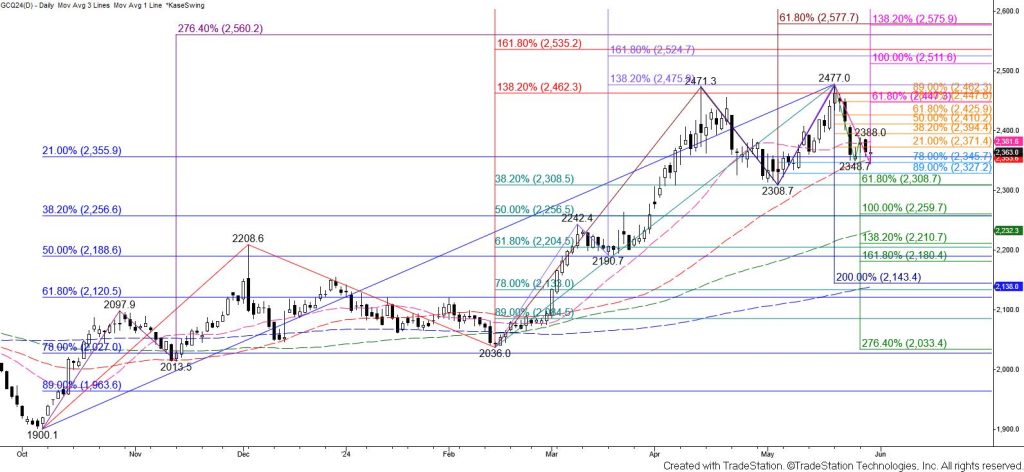
Gold rallied and settled above the equal to (1.00) targets of the wave up from $2304.2 and $2310.9. The 38 percent retracement of the decline from $2477 and the intermediate (1.382) target of the wave up from $2310.9 held on a closing basis. Even so, today’s rise was bullish for the outlook in the coming days and warns that the move down from $2477 might be complete.
Tomorrow, look for a test of $2387. Settling above this will call for a key objective at $2405 to be challenged. The $2405 target is split between the larger than (1.618) target of the wave up from $2304.2 and 62 percent retracement from $2477. Settling above $2405 will strongly suggest that the move down is complete and that gold is readopting a firm bullish outlook.
Nonetheless, there is still a reasonable chance for the move down to extend while $2370 holds on a closing basis. Should gold fall tomorrow and take out $2351 look for a test of key support at $2333. Settling below this will put the near-term odds back in favor of testing the $2309 confirmation point of a double top that formed around $2474 a few weeks ago.