On Friday, WTI crude oil prices pulled back sharply after the U.S. Federal Reserve signaled short-term interest rates may be raised in coming weeks. The U.S. dollar rose, and oil prices fell. The week ended on a negative note, and the corrective pullback extended again on Monday.
Aside from the stronger dollar, media outlets also indicate traders and analysts are weighing the potential consequences of a still oversupplied market against the prospects of a production freeze. Last week, DOE data showed U.S. inventories of oil and refined products have risen to a record high. However, Iran has reportedly shown interest in joining talks with other major producers regarding measures to freeze production in a unified effort to stabilize prices.
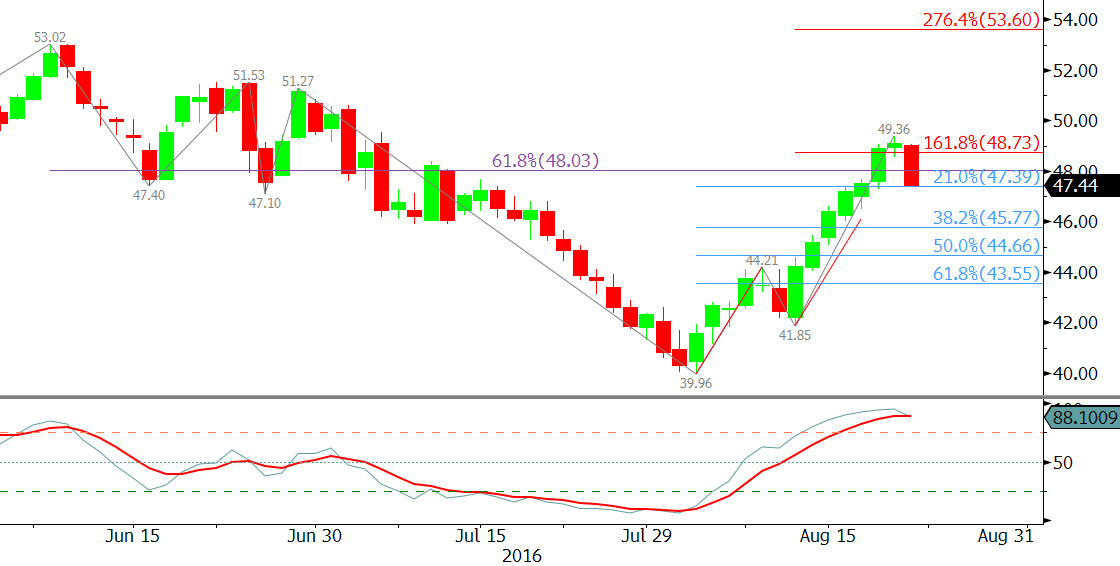
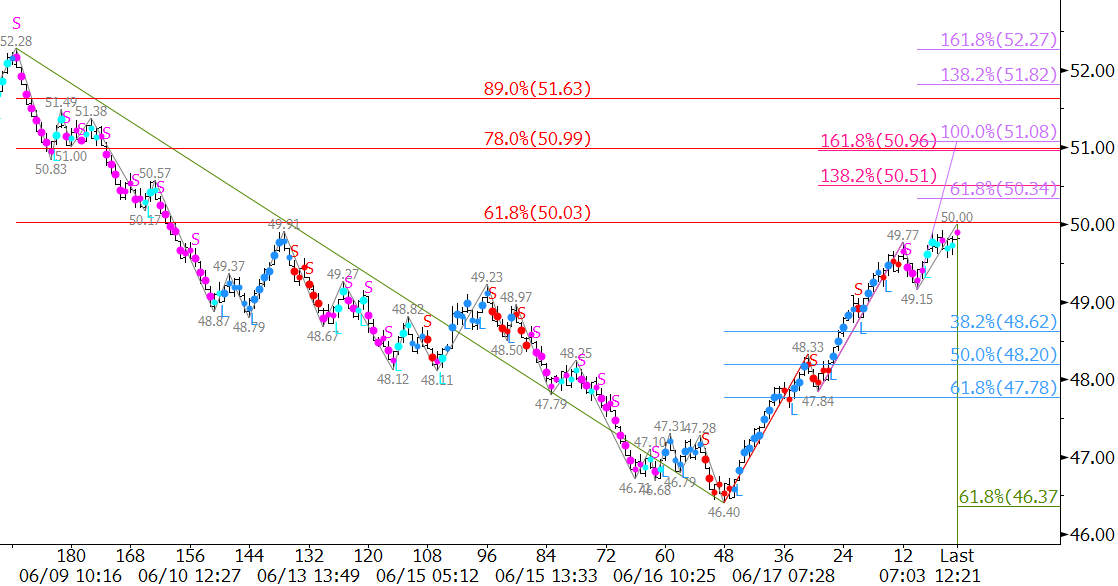
The longer-term technical outlook for oil remains positive. However, near-term factors indicate the corrective decline should continue to extend first. October WTI met the 0.618 projection of the wave $49.36 – 46.42 – 48.46 on Monday. Nearly 80 percent of waves that meet the 0.618 projection extend to the 1.00 projection. Therefore, odds favor $45.5 before the move up continues.
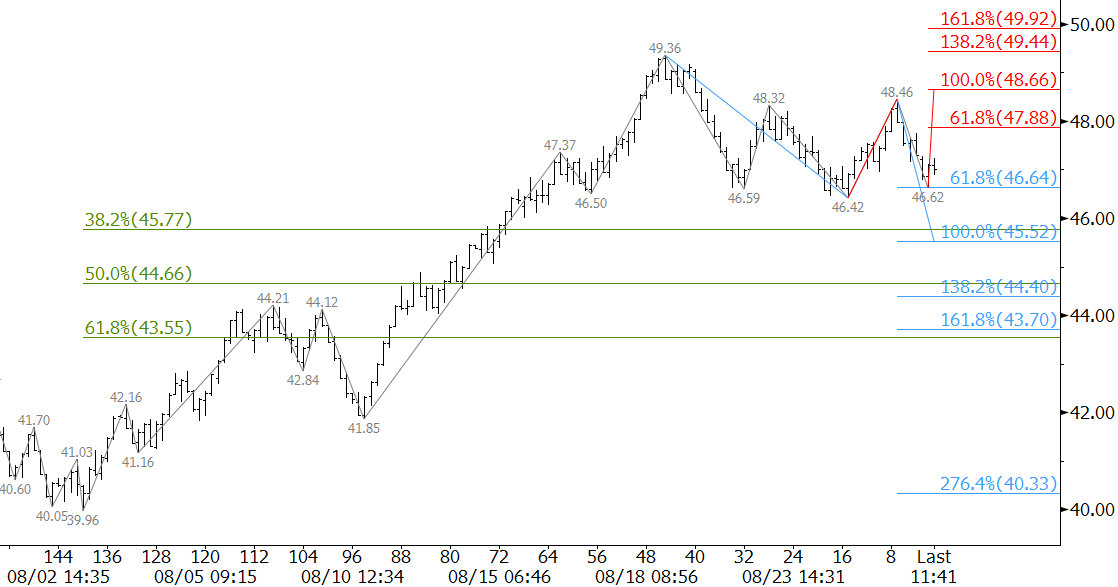
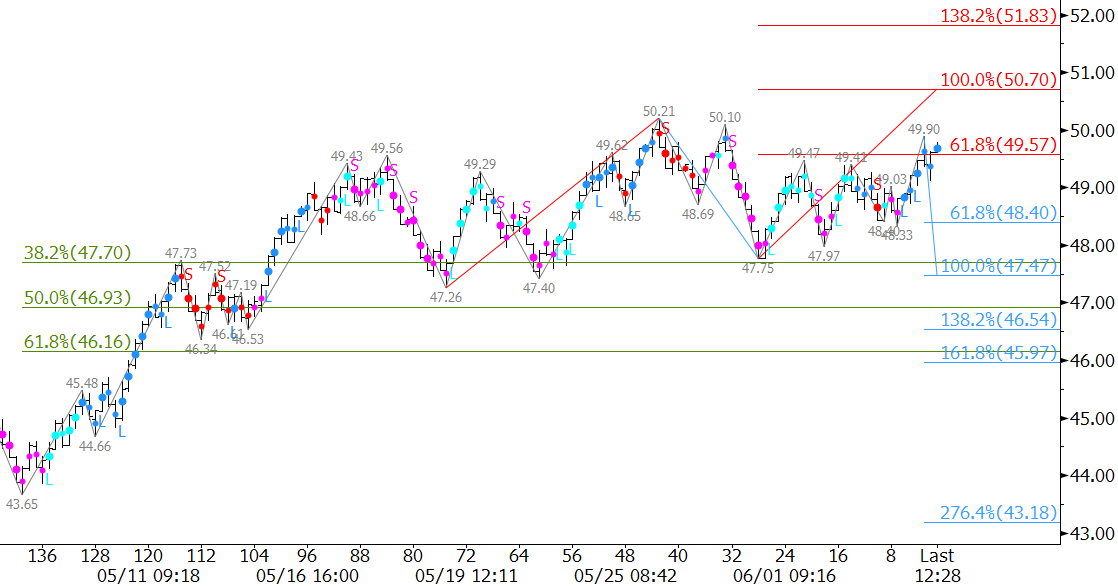
The $45.5 target is important because it is near the 38 percent retracement of the move up from $39.96 to $49.36. A “normal” correction should hold $45.5. A close below $45.5 would open the way for an extended correction and potential trading range in the mid-to-upper $40s.
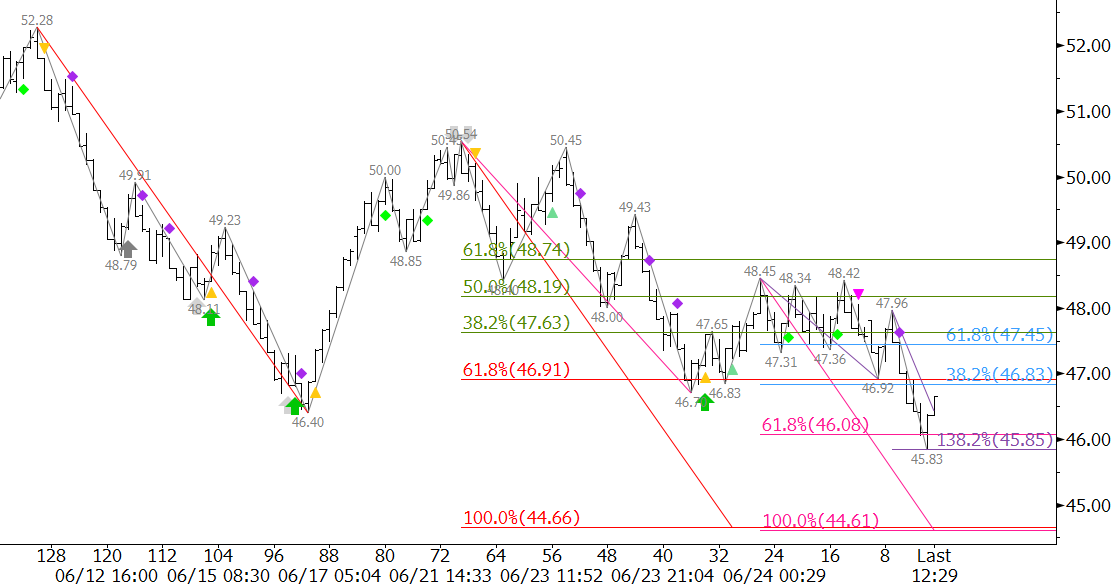
The move down will remain choppy, but over the next few days look for resistance at $47.9 to hold. Key resistance is $48.7. A move to $48.7 would take out the wave down from $49.36 that projects to $45.5 and lower.
This is a brief analysis and outlook for the next day or so. Our weekly Crude Oil Commentary and intraweek updates are a much more detailed and thorough energy price forecast. If you are interested in learning more, please sign up for a complimentary four-week trial.