Crude Oil Forecast: WTI Oil Prices Turn Lower

By Dean Rogers

February WTI turned lower again on Monday and gave up just over 50 percent of its pre-holiday weekend gains that it had made on the move up from $35.35. The supply glut is still a concern and reports of Iran stating that exports are ‘priority’ after sanctions are lifted has put a dose of reality back into the long-term outlook for oil.

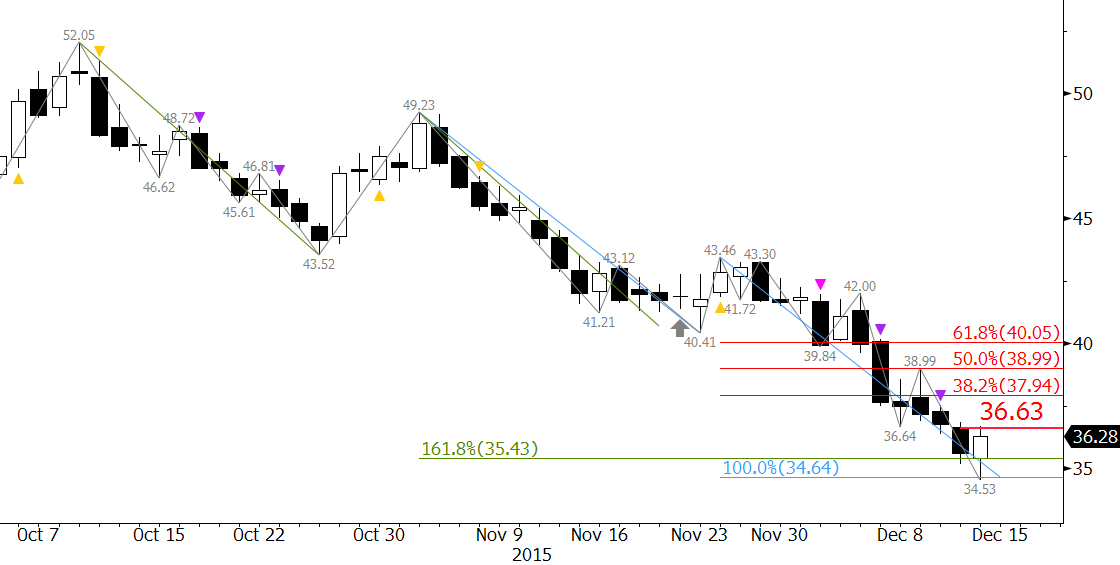
Technical factors reflect the negative near-term outlook. Monday’s close below $37.0 completed December 24’s evening star and indicates the decline should continue. WTI oil prices should now test the evening star’s $36.5 confirmation point. This is also the 62 percent retracement of the move up from $35.35 to $38.28. The $36.5 target is crucial, and it will be important for WTI oil prices to close below $36.5 within the next day or so to confirm that the move down is going to continue. A close below $36.5 is expected and would open the way for $36.1 and $35.2, both of which are confluent wave projections.

CL G6 - eSignal

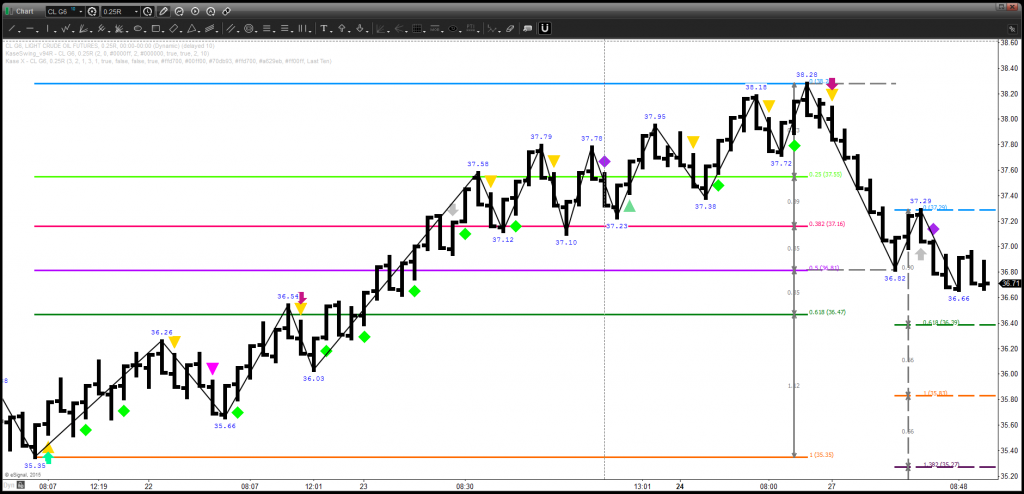
The decline may be a grind lower and small corrections will likely take place, especially if gasoline prices start to rise again. Monday’s $37.4 midpoint should hold, but the key level for a renewed surge higher is $38.0. A close over $38.0 would call for at least $39.6.

This is a brief analysis and outlook for the next day or so. Our weekly Crude Oil Commentary is a much more detailed and thorough energy price forecast. If you are interested in learning more, please sign up for a complimentary four week trial.

By Dean Rogers

The U.S. rig count rose by 17 last week, and according to the EIA, U.S. crude oil supplies have reached 490.7 million barrels, the highest reported level for this time of year since 1930. In addition, the U.S.’s repeal of the 40-year oil export ban could ultimately encourage more pumping from domestic crude oil producers and narrow the WTI-Brent spread closer to parity in coming weeks. This is possibly good news for domestic producers, though it will take months and perhaps years before we will truly know. Overall, it is being reported that these factors could prolong the supply glut that is projected to last through the end of 2016 and possibly beyond.

The narrowing WTI-Brent spread is a being driven by WTI’s deeper contango versus Brent. In January 2015, the two grades were trading near parity, and it looks like this will be the case again in early 2016. This is encouraging for some U.S. producers as the spread could extend into positive territory where $2.60 is a confluent projection. However, longer-term, a narrow spread would likely lead to increased U.S. production, which would be negative for WTI. Conversely, a positive spread could encourage Brent producers to cutback, thus spurring both grades higher over the course of the longer-term. The key will be seeing whether or not the spread becomes positive and remains that way for the next few months. If so, it could lead to a longer-term shift in production strategies, and ultimately prices, world-wide.

WTI-Brent-Spread

Another factor to watch right now is the calendar spreads and the cost of carry. The six-month average cost of carry narrowed a bit for WTI and Brent last week, but remains volatile. Typically, a carry above approximately ($0.50) encourages those with storage to buy oil now, store it, and then sell it at a later date when prices are higher (due to deep contango). This is fundamentally negative because supply rises. The six-month average costs of carry for WTI was ($0.93) and for Brent ($0.79) as of Friday’s settlement.

CostOfCarry

The technical agree with the negative fundamental and spread factors right now. Most momentum indicators are oversold and setup for divergence on the weekly and daily charts. Therefore, a correction might take place soon. However, until a swing low in both price and momentum are made look for the decline to continue. Over the next day or so we expect WTI to fall to $35.0 and for Brent to challenge $35.6. Both are crucial targets to connect to much lower levels as discussed in our full weekly analysis.

This is a brief analysis and outlook for the next day or so. Our weekly Crude Oil Commentary is a much more detailed and thorough energy price forecast. If you are interested in learning more, please sign up for a complimentary four-week trial.

By Dean Rogers

The darkest hour is just before the dawn. It is a phrase that most are familiar with that provides hope, even in the worst of circumstances. The outlook for WTI crude oil prices has been “dark” in recent weeks, and the longer-term outlook is still dim. However, December 14’s close over $36.13 provides a small shimmer of hope that a correction might finally be underway.

January WTI met a confluent and structurally crucial support target near $35.0 on December 14 and closed above December 11’s $36.13 midpoint to form a bullish piercing pattern. The piercing pattern is an early indication that a sustainable correction might finally be underway. A close over the pattern’s $36.63 confirmation point (December 11’s open) would call for at least $37.9, the 38 percent retracement from $43.46 to $34.53.

CLF6 20151214

The move up will most likely be corrective, but a substantial correction is long overdue. KaseX is not showing any signs of a turn yet, and the piercing pattern’s $36.63 confirmation point was tested and held. This dampens the likelihood of a reversal, but does not wipe out the potential completely. A close below $35.4 would negate the piercing pattern and call for the decline to continue towards the December 2008 perpetual swing low of $32.4.

Therefore, if the sun is going to rise $35.4 must hold and January WTI will need to close over $36.63 and then $37.9 within the next few days.

This is a brief analysis and outlook for the next day or so. Our weekly Crude Oil Commentary is a much more detailed and thorough energy price forecast. If you are interested in learning more, please sign up for a complimentary four week trial.

By Dean Rogers

January WTI futures met crucial support at $40.41 early Monday. This was the 1.00 projection for the wave $52.02 – 43.52 – 49.23. The subsequent move up was initially promising for bulls, but stalled at $42.75 before it could overcome $43.2 resistance.

CLF6 20151123-DIt is a tight call tomorrow, but we expect a test of $40.9 before the move up continues. This is confirmed on the intraday charts by the latest KaseX weak short signal (pink triangle). Support at $40.9 is near the 0.618 projection of the wave $42.75 – 41.09 – 42.62 and the $41.09 swing low. A close below $40.9 would call for $40.0 and possibly lower.

CLF6 20151123

Conversely, not all hope is lost for the upward correction to extend. The daily chart’s Kase Easy Entry System (KEES) permissions shifted from first class short (pink dots) to second class long (light blue dot). Therefore, there is still a reasonable chance for a close over $43.2 and an upward correction to $43.8, the 38 percent retracement from $49.23 to $40.41. A close over $43.8 would significantly increase the probability for an extended move to test major resistance levels.

This is a brief analysis and outlook for the next day or so. Our weekly Crude Oil forecast is a much more detailed and thorough energy price forecast. If you are interested, please sign up for a complimentary four week trial.

By Dean Rogers

WTI stalled near $48.0 as we expected in our weekly Crude Oil Commentary and the sustained close below $44.7 calls for a test of key support at $43.2. This is a confluence area that is near the 0.618 projection of the wave $51.42 – 42.58 – 48.36. A close below $43.2 would confirm the negative outlook and open the way for a continued decline.

The Kase Easy Entry System (KEES) confirms the negative bias. Today’s pink dot indicates that the majority of momentum indicators are permissioned short on the daily chart and that the synthetic three-day filter is also permissioned short.

CLZ5 20151109

That said, the shorter intraday bar lengths are showing that the decline from $48.36 is a bit overextended, exhausted, and due for a correction. The correction will most likely take place once $43.2 is met. First resistance is $44.5. Key resistance is $45.4, the 38 percent retracement from $48.36 to $43.64. Both levels are in line with the opening prices of the last few days. A close over $45.4 would call for an extended upward correction and a likely trading range for the near-term.

This is a brief analysis and crude oil forecast for the next day or so. Our weekly Crude Oil Commentary is a much more detailed and thorough energy price forecast. If you are interested, please sign up for a complimentary four week trial.

By Dean Rogers

December WTI’s wave $39.22 – 50.89 – 44.31, which met its 0.618 projection at $51.42, has been taken out by the $43.64 swing low. Consequently a technical failure of the move up has taken place and odds have shifted in favor of a continued decline. Look for $43.0 tomorrow and very likely $42.5 over the next few days. A close below $42.5 would confirm the negative outlook and technical failure. There is an outside chance that the support trend line will hold. Look for resistance at $45.4 and $46.5.

CLZ5 20151026

This is a brief analysis and outlook for the next day or so. Our weekly Crude Oil Commentary is a much more detailed and thorough energy price forecast. If you are interested, please sign up for a complimentary four week trial.

By Dean Rogers

December WTI’s wave $39.22 – 50.89 – 44.31 met its 0.618 projection at $51.42. This was positive, especially due to the break higher out of the bullish pennant formation. We anticipated the pullback from $51.42, but so far it has been stronger than expected and is poised to test major support levels at $46.0 and $44.3.

Kase’s studies show that waves that meet the 0.618 projection extend to the 1.00 projection 80 percent of the time. This would have pushed prices to $56.0. However, the pullback from $51.42 has been strong and closed below $47.0 support on Monday. Therefore, this may be 20 percent of the time that a wave fails to meet its 1.00 projection.

CLZ5 20151019

First support is $46.0, and a close below this would open the way for $44.31. This is the swing low of the wave up from $39.22 and is in line with the 0.618 projection of the wave down from $51.42. Taking out $44.31 would result in a technical failure of the move up and call an extremely bearish outlook for foreseeable future.

Look for immediate resistance at $46.9, $47.6, and then $48.4.

This is a brief analysis and outlook for the next day or so. Our weekly Crude Oil Commentary is a much more detailed and thorough energy price forecast. If you are interested, please sign up for a complimentary four week trial.

By Dean Rogers

Last week’s break higher out of the bullish pennant was positive and the move up extended to meet the 0.618 projection of the wave $38.51 – $50.04 – 43.71. However the move stalled there, formed a bearish evening star and blow-off high, and then proceeded to test $46.4, the 62 percent retracement of the move up from $43.71.

CLX5 20151013

The market is telling us that it needs more time to sort itself out as it awaits more data. We have stated that the move up would likely be a grind higher, and so far that has been the case.

For now, another trading range will likely form between $46.4 and $50.0. Look for resistance at $47.4 and $48.2.

Should prices fall below the $43.71 swing low the outlook will shift back to negative for the longer-term.

This is a brief analysis and outlook for the next day or so. Our weekly Crude Oil Commentary is a much more detailed and thorough energy price forecast. If you are interested, please sign up for a complimentary four week trial.

By Dean Rogers

After the late August rally WTI settled into a narrowing range that forms a pennant. This is a continuation pattern that indicates odds favor a break higher. However, these odds are somewhat dampened due to the price rise that took place before their formation was small in comparison to the size of the formation. In addition, more than half of the price rise has already been eroded.

wti crude oil

The small wave up from $43.71 indicates that a close over $46.0 would call for $47.0, which is in line with the top of the pennant.

We like support at $44.1 to hold, but $43.0, near the 62 percent retracement of the move up, is the key for a negative outlook.

On balance, even if prices break higher or lower out of the pennant, we could see crude oil continue to oscillate in a wider range for another few weeks while the market sorts out fundamental and geopolitical factors.

This is a brief analysis and outlook for the next day or so. Our weekly Crude Oil Commentary is a much more detailed and thorough energy price forecast. If you are interested, please sign up for a complimentary four week trial.

By Dean Rogers

Last week we stated WTI and Brent would likely settled into trading ranges while sorting out longer-term fundamental factors and the late August price surge. That has been the case, and so far the oscillations have formed a flat descending triangle for WTI and a pennant for Brent.

WTI and Brent patterns

Both patterns are bullish, but have a higher than normal probability to fail in our opinion. Even upon a break higher we do not expect a bullish rally to ensue, but rather a test of the recent swing highs.

Should the patterns fail look for major support at $42.6 for WTI and $46.7 for Brent. In other words, we think the trading range will continue to form between approximately $42.6 and $49.0 for WTI and $46.7 and $52.0 for Brent.

This is a brief analysis and outlook for the next day or so. Our weekly Crude Oil Commentary is a much more detailed and thorough energy price forecast. If you are interested, please sign up for a complimentary four week trial.