By Dean Rogers
Last week we stated WTI and Brent would likely settled into trading ranges while sorting out longer-term fundamental factors and the late August price surge. That has been the case, and so far the oscillations have formed a flat descending triangle for WTI and a pennant for Brent.
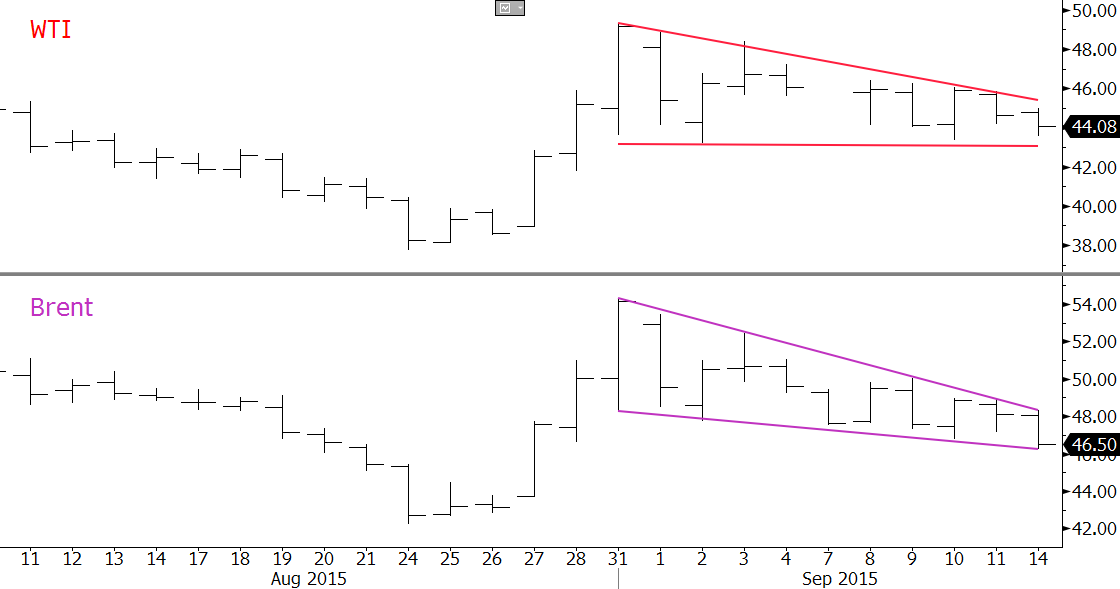
Both patterns are bullish, but have a higher than normal probability to fail in our opinion. Even upon a break higher we do not expect a bullish rally to ensue, but rather a test of the recent swing highs.
Should the patterns fail look for major support at $42.6 for WTI and $46.7 for Brent. In other words, we think the trading range will continue to form between approximately $42.6 and $49.0 for WTI and $46.7 and $52.0 for Brent.
This is a brief analysis and outlook for the next day or so. Our weekly Crude Oil Commentary is a much more detailed and thorough energy price forecast. If you are interested, please sign up for a complimentary four week trial.