Apple Inc. (AAPL)
Apple’s stock has taken a bit of a beating this year, and the holiday season has not been the boon loyal shareholders had hoped for. Most technical factors are negative and odds favor a continued decline. However, there are a few positive technical factors that indicate the upward correction that began on November 21 could extend first.
Overall, the outlook is for AAPL is negative and our technical price forecasting model indicates that over the next ten days there is a 70 percent chance for $106.4 and a 60 percent chance for $103.8.
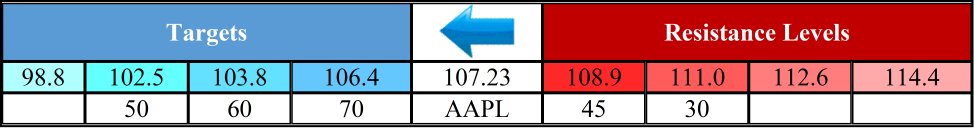
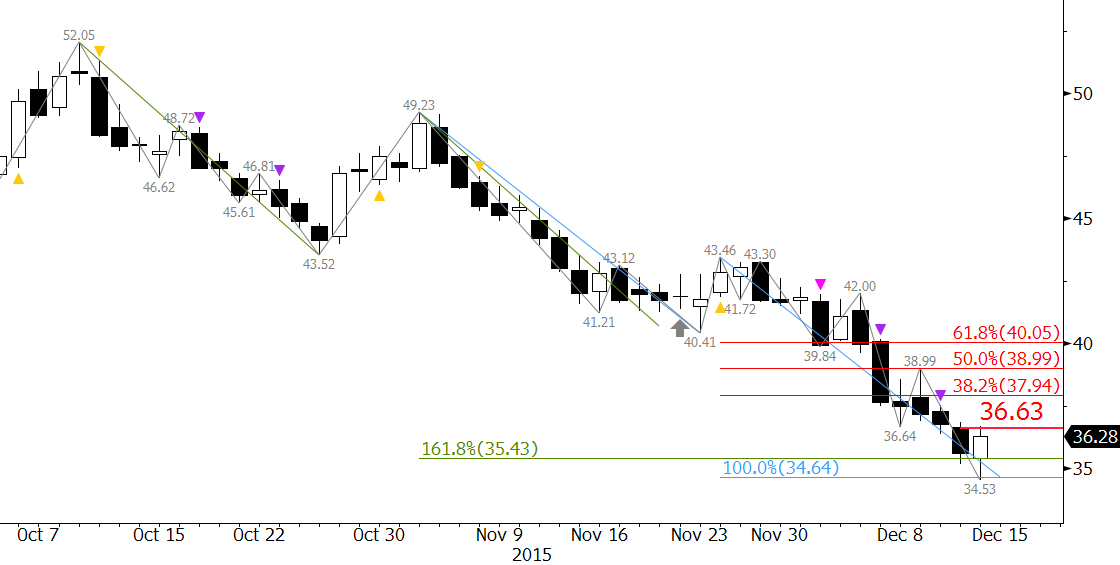
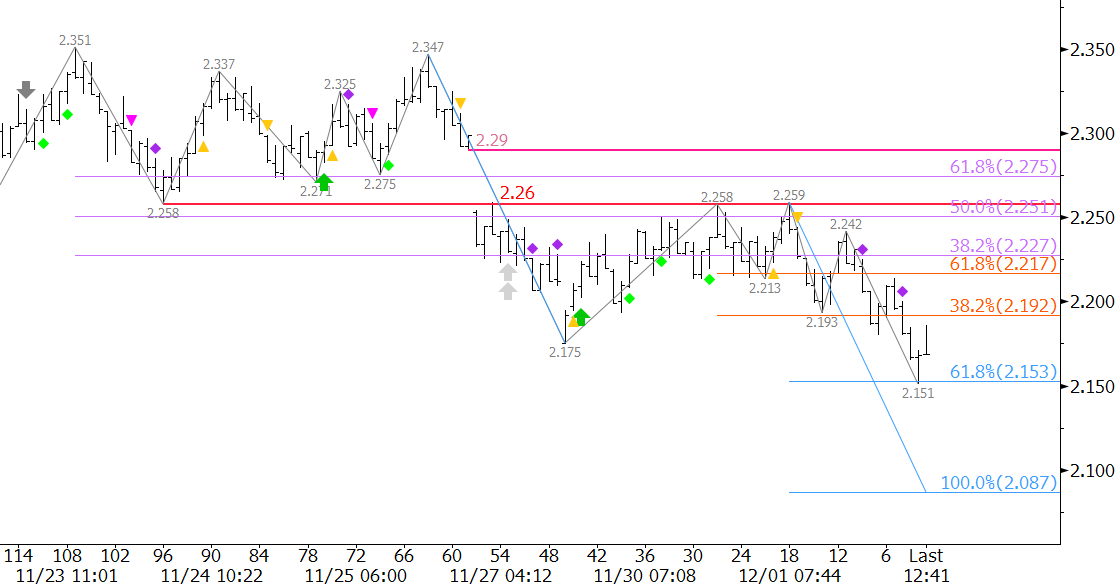
The decline from $123.82 is forming a five-wave trending pattern, and $102.5 is the key support target for the formation. Wave III is currently in progress and $102.5 is a potential stalling point and beginning of Wave IV. Should prices settle below $102.5 look for Wave IV to form from $98.8.
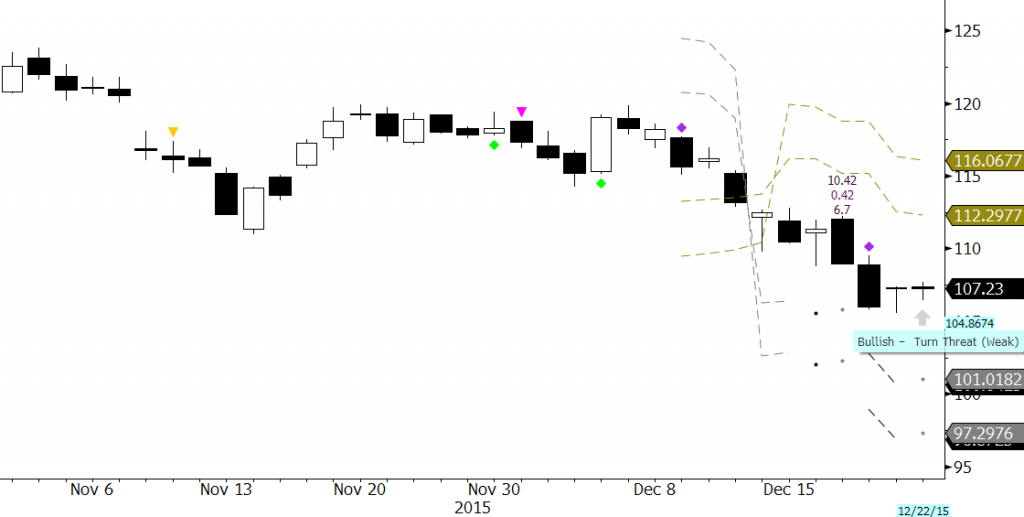
There is some technical evidence that indicates AAPL could rise to $108.9 and even $111.0 before the first target at $106.4 is met. The decline stalled at $105.57 on Monday, formed a pseudo hammer, and has been flirting with Friday’s $107.5 midpoint. In addition, KaseX, shown in the chart below, confirmed a weak bullish turn threat (gray arrow). The signal indicates stops on the daily chart could be tightened to approximately $112.3, which is in line with our $112.6 resistance threshold.
If the upward correction is going to extend in a significant manner it will need to close over at least $108.9 and very likely $111.0. The latter is strong near-term resistance that we expect to hold. A close over $111.0 would open the way for and extended upward correction to $112.6 and even $114.4.
Under Armour Inc (UA)
Since September UA’s stock performance has been dismal relative to that of their largest competitor, Nike (NKE), whose earnings hit the street Tuesday afternoon. NKE is pegged as one of the strongest performing stocks in the Dow Jones Industrial average, up 35 percent so far. The outlook for NKE, at least from a technical standpoint, is bullish. Conversely, we expect UA’s share price to continue to decline.
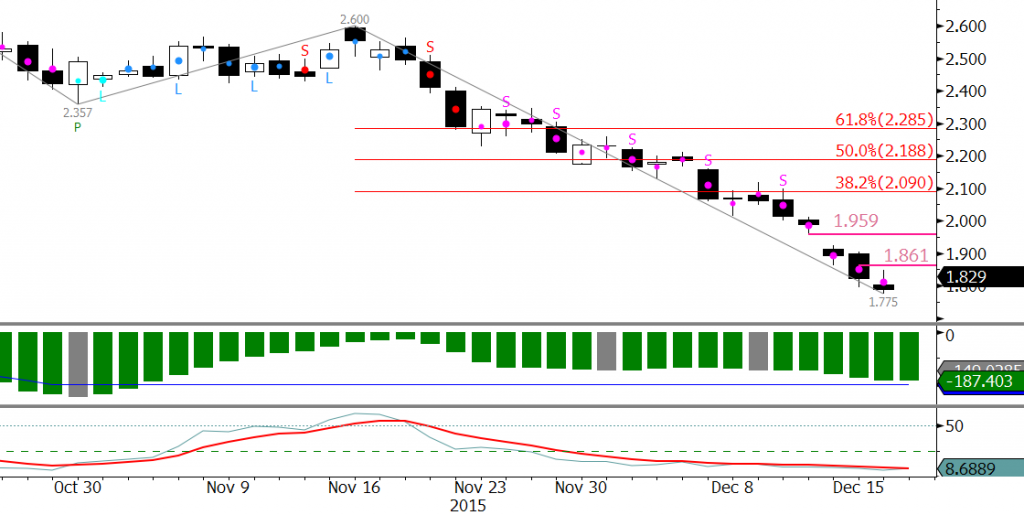
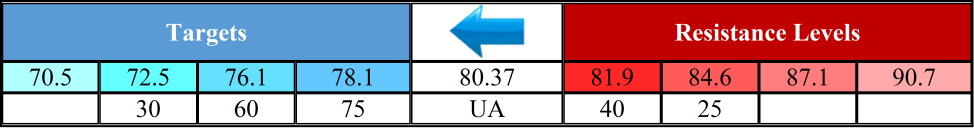
Most technical factors for UA are negative and odds are 75 percent for at least $78.1. This then connects to key support at $76.1. Longer-term odds favor $72.5 and $70.5, but we expect a correction to take place before the lower targets are met.
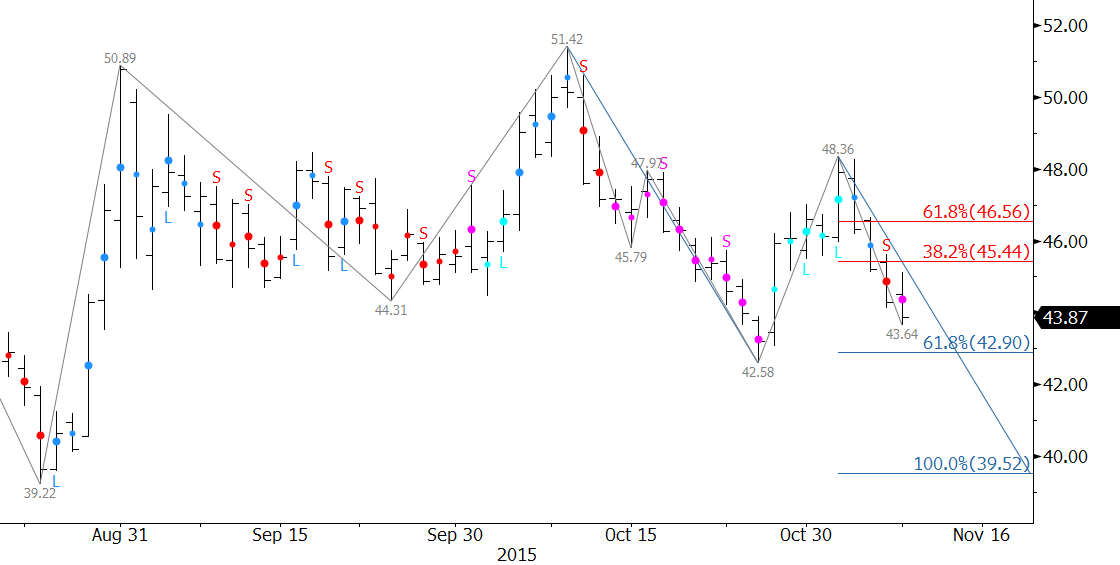
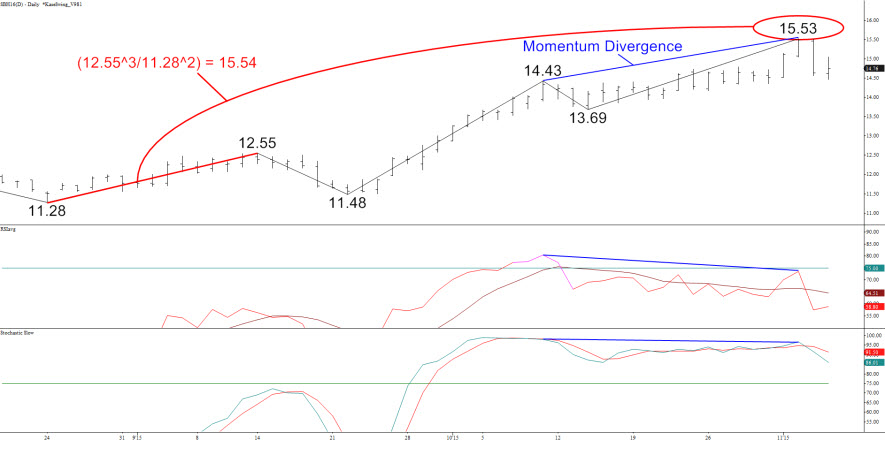
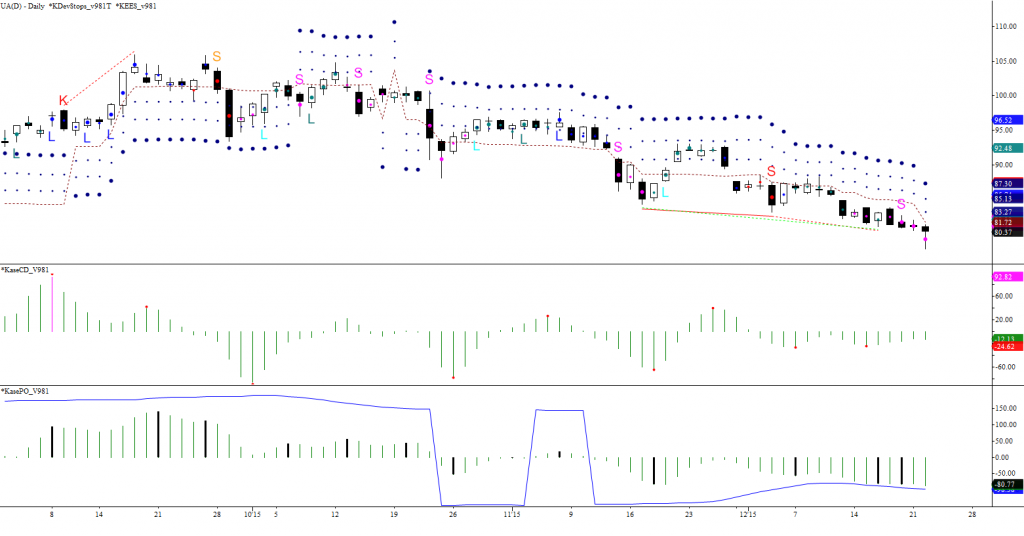
Kase StatWare, shown in the chart below, reflects the bearish sentiment with first class short KEES permissions (pink dots) on the daily bars for the past few days. That said, momentum on the KaseCD and KasePO are setup for divergence and the KasePO is nearing oversold territory. This means that a correction might take place soon.
The one solid positive technical factor was November 22’s hammer. This is a reversal pattern that also indicates a correction might take place before UA falls below $78.1 again. The correction should hold $81.9, but $84.6 is the key threshold. A close over this would open the way for an extended upward correction before the decline ultimately continues.
These are brief technical analyses based upon Kase’s technical forecasting models and trading indicators KaseX and Kase StatWare. If you are interested in taking a trial of KaseX or Kase StatWare please contact sales@kaseco.com. We would love to get your thoughts about the forecasted targets and probabilities. Leave a comment or send them along with your request for a trial to sales@kaseco.com.