By Dean Rogers
Technical analysis provides traders and market analysts with extremely valuable tools that can help determine future support and resistance and major turning points. A good example of this came from our recent article Ask Kase: How to Trade the Shanghai Index that was published on June 9, 2015 by Cynthia A. Kase, CMT, MFTA. Ms. Kase’s analysis lead her to call for an overdue downward correction of the Shanghai Composite Index (SSE) once resistance at 5200 was met within a +/- 50 point tolerance. SSE rose to 5178.19 on June 12, before turning lower and eventually transitioning into the bearish collapse that has transpired over the past several weeks.
The market has blown through Ms. Kase’s lowest support level of 4550, below which she stated, “a much more sustained decline would commence”. She hit the nail on the head, and now, the techncials are showing us that SSE is poised for at least 2300 after a potential upward correction from 2947.94.
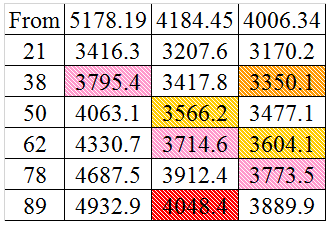
The decline from 5178.19 forms a very clear nested wave formation that has two primary waves: 5178.19 – 3373.54 – 4184.45 (blue) and 4184.45 – 3537.36 – 4006.34 (green). Both waves project to 2300 +/- 80 points. This is a very important target and potential bottom for SSE because it is the 1.00 projection for the wave down from 5178.19 (blue) and the 2.764 projection for the wave down from 4184.45 (green).
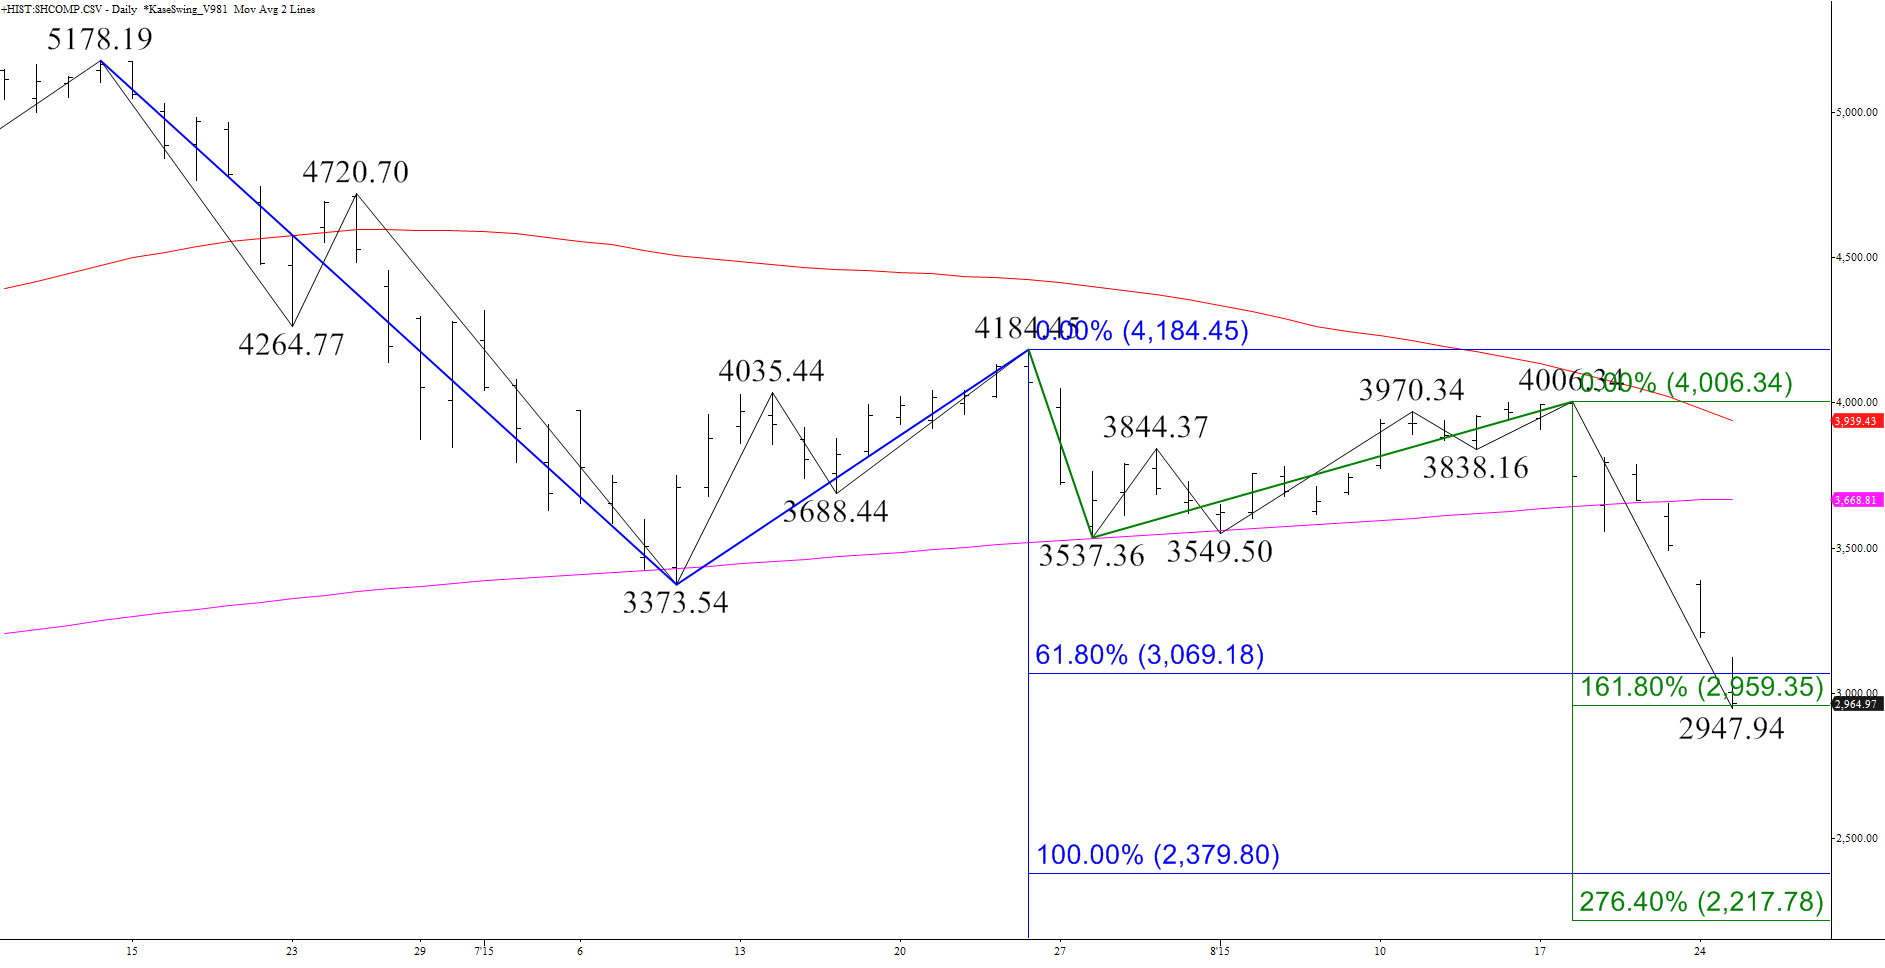
A sustained close below 2300 would call for a much more severe collapse to 2034, 1710, and possibly 1275.
As stated though, an upward correction might take place from 2947.94 before the decline continues. This is because both of the waves down from 5178.19 and 4184.45 met crucial projections around 3000. The 3000 level was also in line with the 62 percent retracement of the move up from the October 2008 swing low of 1664.93 to 5178.19.
To say the least, 3000 is important support, so a small correction to 3350, the 38 percent retracement of the decline form 4006.34 would be normal.
Key resistance for the near term is 3585, the 62 percent retracement from 4006.34 and the 50 percent retracement from 4184.45. A close over 3585 would open the way for 3755, the 62 percent retracement from 4184.45 and the 38 percent retracement from 5178.19. This is the level that must hold for the outlook to remain negative for at least the next few weeks.
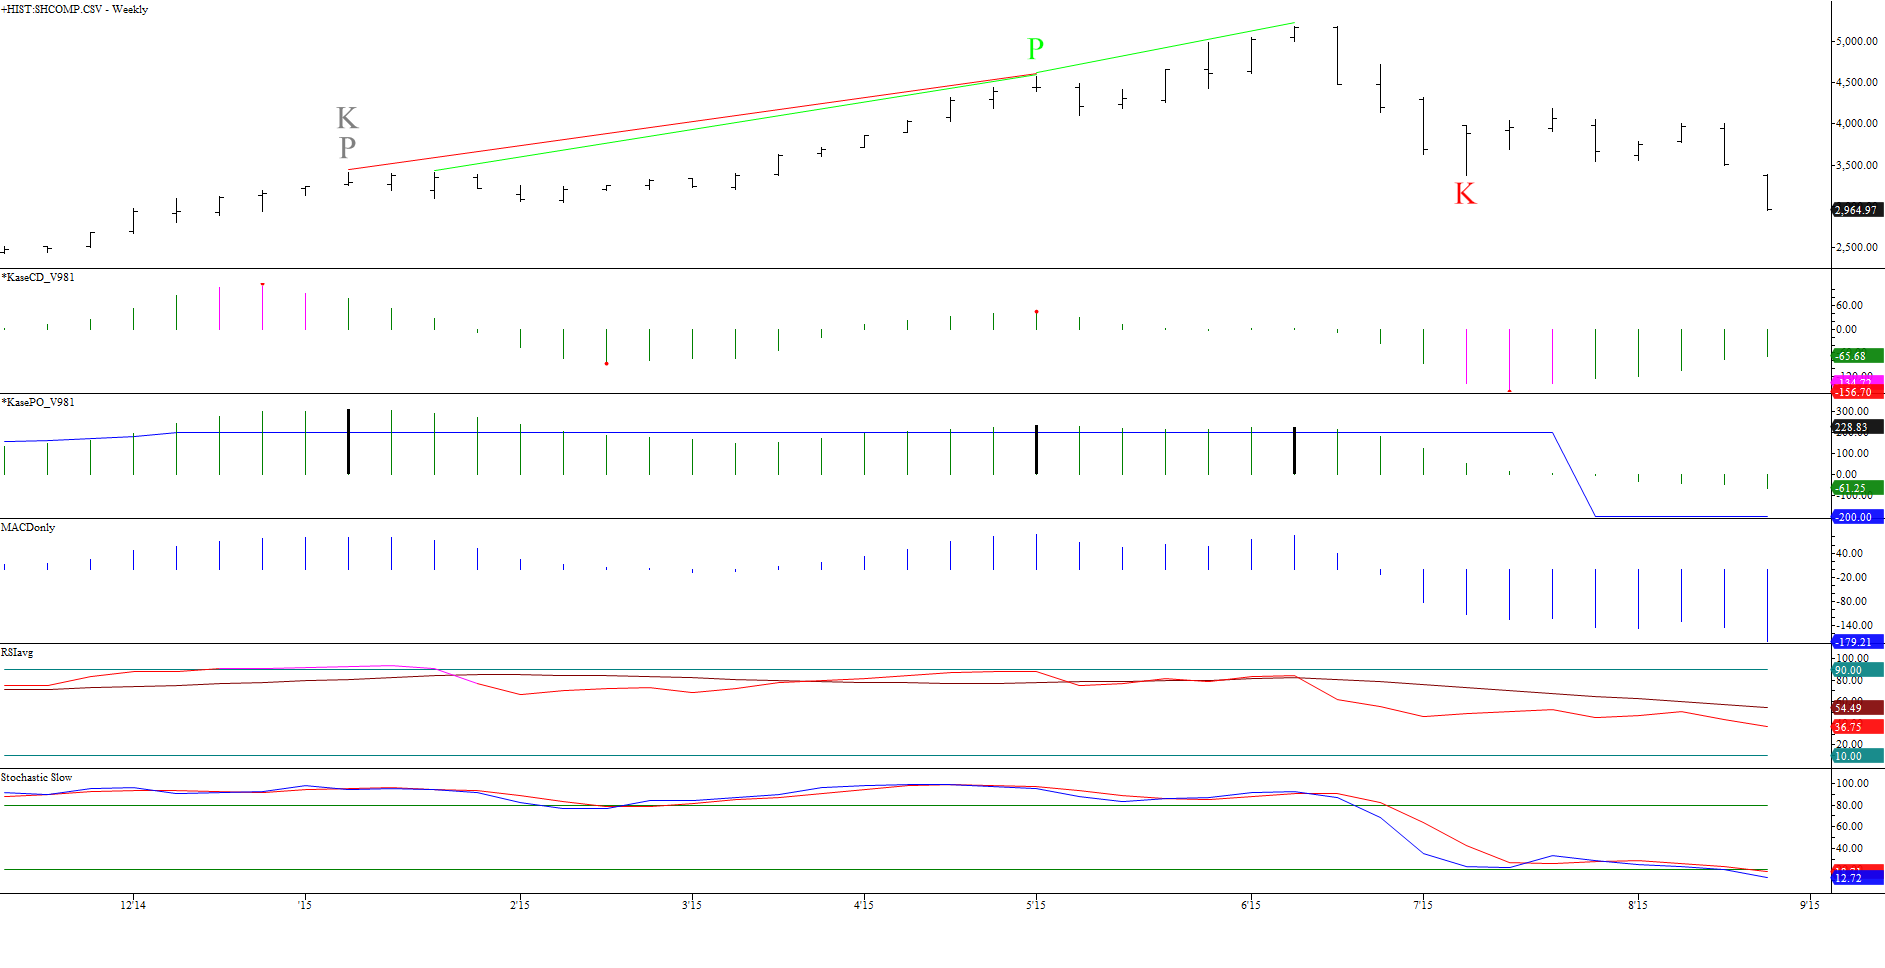
A daily morning star setup (not shown) confirms that the upward correction might take place within the next few days. However, most momentum indicators show that a pullback will be nothing more than a temporary correction.
The weekly stochastic moved below 20 and is oversold, but it can remain there for weeks (or even months) before the index reverses significantly higher. All other momentum indicators, including the KaseCD and KasePO show declining momentum, which does not bode well for the formation of a bottom soon.
In summary, most technical factors are negative and odds favor a decline to at least 2300. A pullback from 2947.94 might take place first, but weekly and daily momentum indicators show that such a move will likely be corrective and should hold resistance at 3350 and no higher than 3585. Therefore, for now, buckle in for the rest of the ride lower.
Learn more about Kase’s trading indicators such as the KasePO and KaseCD, weekly crude oil and natural gas forecasts, and other services, at www.kaseco.com.