 by Cynthia A. Kase
Read on TraderPlanet.com
Will the 10 Year US Treasury Note be Playing “Bass”?
As the 2H2015 commences, fundamental market analysts are lamenting the stock market’s prospects, pointing to low earnings and higher borrowing costs. US Treasury yield spreads are looking positive, which should be, in turn, negative for longer-dated fixed income instruments. So the key question is “will the 10-year note be playing ‘bass’ during the remainder of the year?” How low will the note go?
From a 131’05.5 January high, TY fell to 124’29 last Friday, June 26. There’s been a bounce these last two days, likely due to Greece. The decline has been choppy. It’s likely to extend and remain so.
Major resistance is 128’0. This is the 1.0, or “equal” Fibonacci extension and the Phi corrective projection for the major wave up, 124’29 – 126’29 – 125’19. This also corresponds to KaseDev4.5 on the daily chart and KaseDev1 weekly.
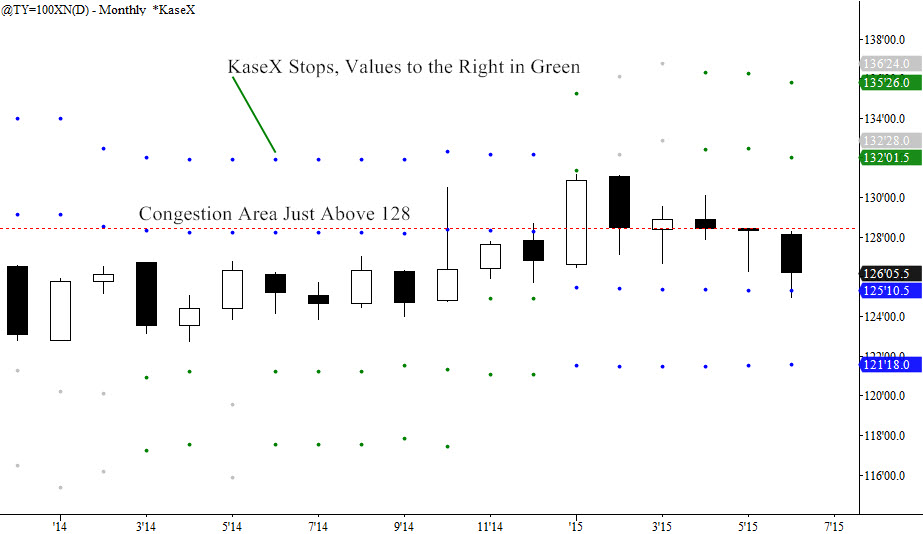
In addition, 128’0 is the 50 percent retracement of the entire move down from 131’05.5, is an area of previous congestion, and right around June’s monthly high. Provided prices stay below 128’0, the downside looms. Should there be sustained close over this area, the targets are 129’16.5, 132’07, 135’30 and 136’26.5. Note how the KaseX stops show 132’01.5 and 135’26 as confluent on the monthly chart. Should the 129’16.5 be hit, the following targets might rapidly be reached. Again, this is not envisioned, but describes the lower probability outcome.
TY Monthly Chart with KaseX Stops and Congestion Area
Charts created using TradeStation. ©TradeStation Technologies, Inc. 2001-2015. All rights reserved. No investment or trading advice, recommendation or opinions are being given or intended
Monday and Tuesday formed stars which are indicative of uncertainty given that the days’ opens and closes were close together. Also Tuesday’s closed only 1/32nd down from Monday. Monday’s high spiked over 127’0, filled the gap left on June 22’s open, but did not close within the gap, much less over. The two stars seem suspended above blank space.
The key supportive issue is that a price of 124’17.5, just below the current low, is highly confluent, being the 0.62 or 1.0 Fibonacci extension for many waves down from swing highs of 133’25, 130’40, and 128’10.5, and the 78 percent retracement, the next in line to be tested, of the entire move up from 122’22.5. It’s also the f corrective projection for the major wave 131’05.5 – 126’20 – 130’40. Technically, this is likely the main reason there’s been a bounce these last two days.
Nevertheless the probability of a break down to 122’26.5 is high, with 65 percent odds thereafter for 120’28 to form temporary support, and then for 118’07, which might hold, at least for a while. These latter three targets are the 1.62 Fibonacci extension, Phi2 corrective projection, and trend terminus of the very same wave, respectively.
So watch 128’0 and 124’17.5 for direction, with a bias to the downside.
Remember to send your questions for next week to askkase@kaseco.com. For more information about Kase’s services please visit www.kaseco.com.
2 thoughts on “Ask Kase: 10 Year US Treasury Note”