Natural Gas Price Forecast
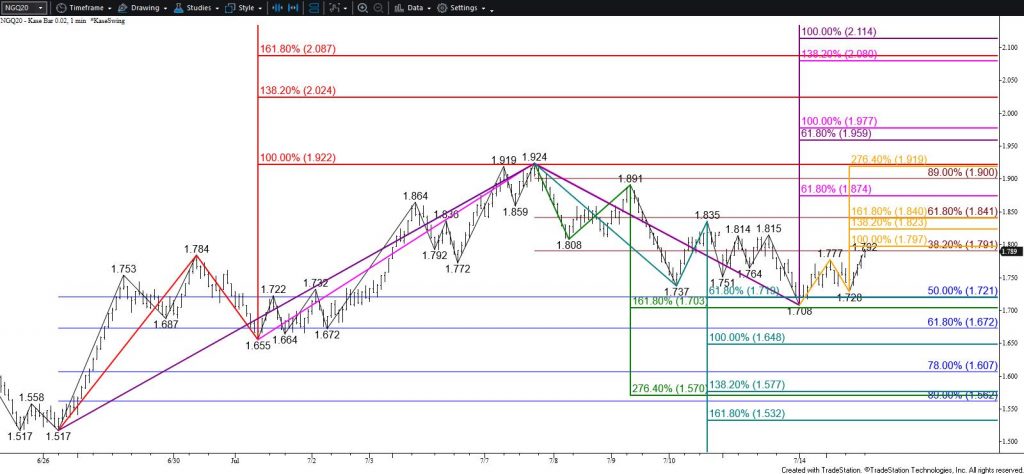
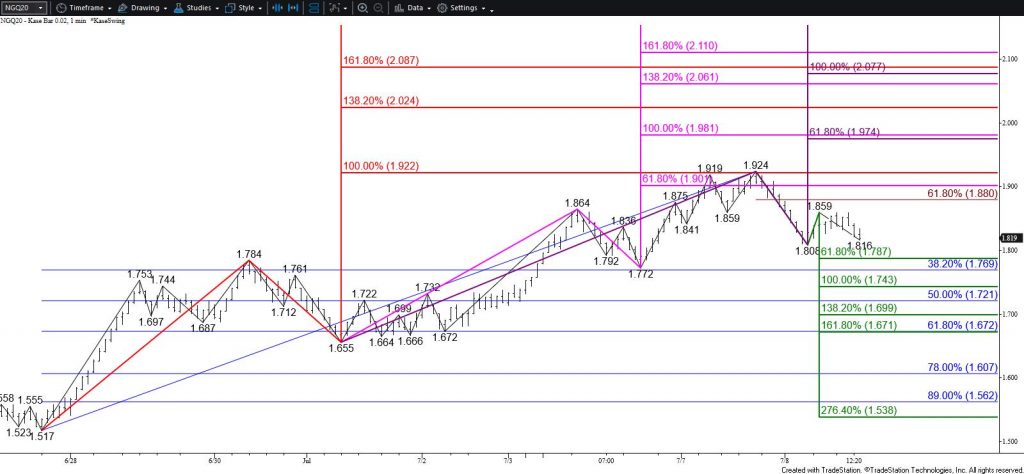
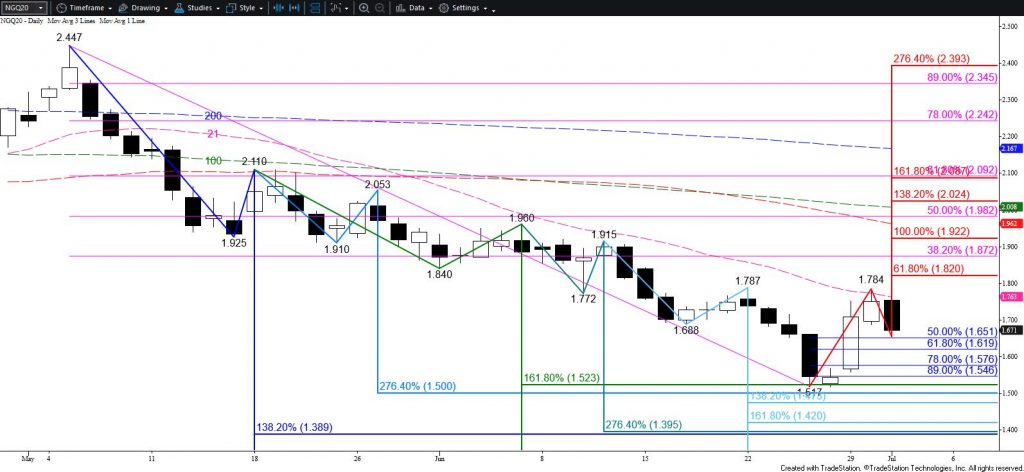
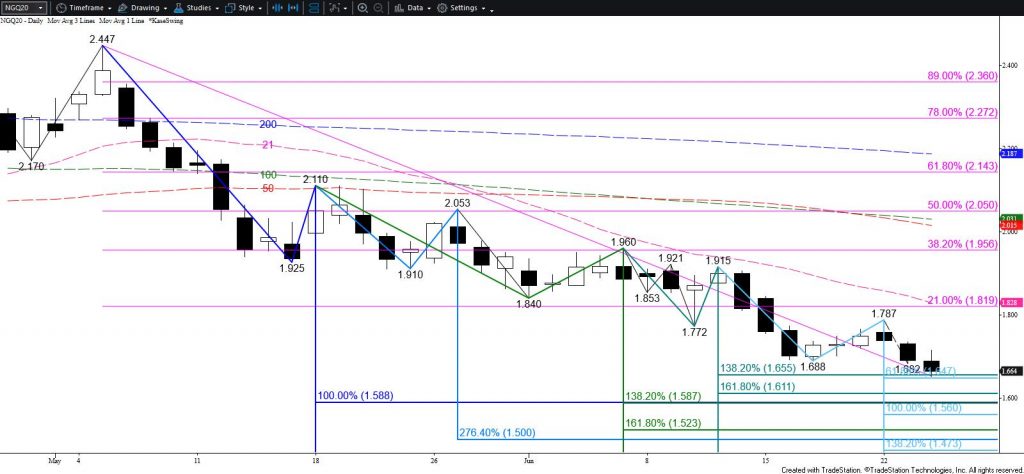
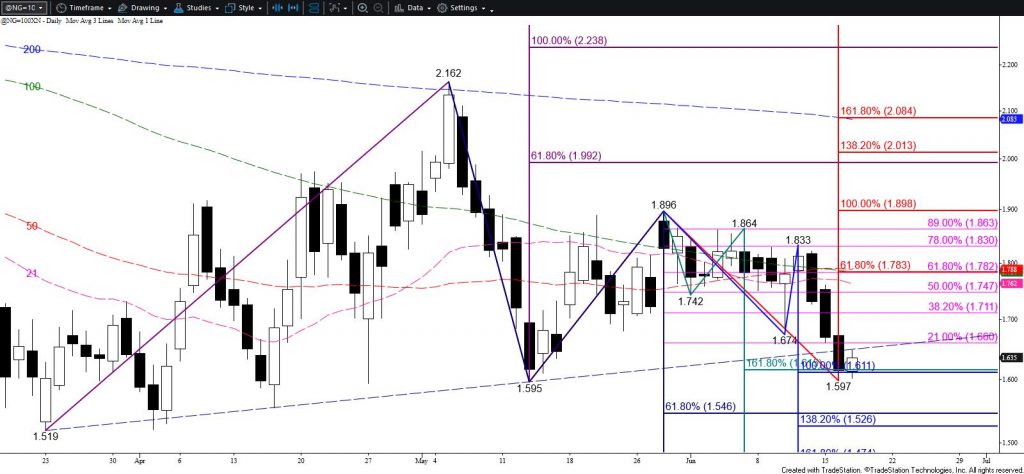
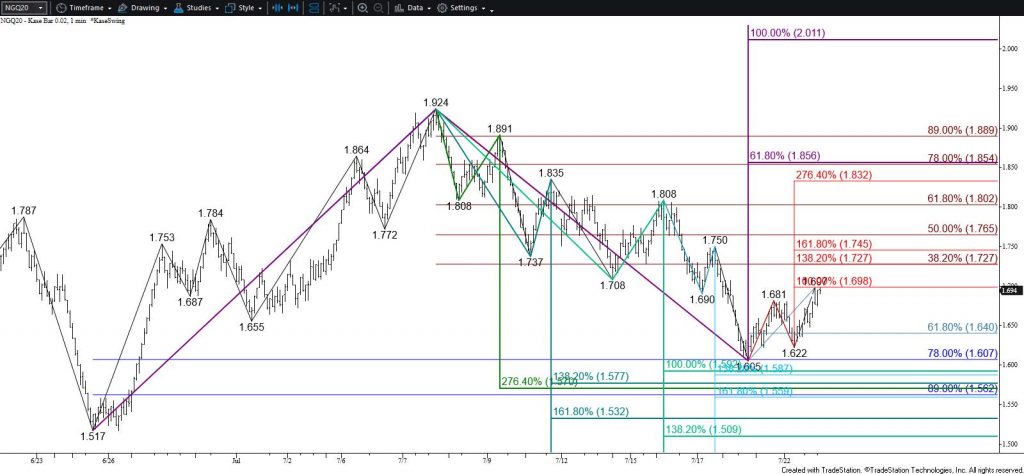
September natural gas settled above the crucial $1.90 level today. This was the smaller than (0.618) target of the primary waves up from $1.583 and $1.646. Most importantly, $1.90 has been near the top of the trading range on the continuation chart since mid-May and was the smaller than target of the wave up from $1.432.
Closing above $1.90 was bullish for the near-term outlook and calls for prices to challenge $2.00 and possibly $2.07. For September $2.00 is the equal to (1.00) target of the wave up from $1.646 and $2.07 is the equal to target of the larger wave up from $1.583. Therefore, September’s wave formation calls for prices to eventually reach $2.07. However, $2.00 is a psychologically important threshold that is in line with the 200-day moving average on the continuation chart. Therefore, natural gas will likely be hard-pressed to overcome $2.00 during the next few days and perhaps even the next several weeks.
Also, with August expiring at $1.854 today prompt month prices may be drawn down to close the rollover gap before rising much higher.
Nevertheless, there are no confirmed patterns or signals that call for the move up to stall before reaching at least $1.95 and likely $2.00.
Should natural gas turn lower early tomorrow, look for initial support at $1.88 and then $1.83. These are the 21 and 38 percent retracements of the move up from $1.646. At $1.83 the rollover gap up from $1.854 will be filled. Therefore, this level is expected to hold. Closing below $1.83 will provide more evidence that prices are still trading in a wide range between nominally $1.60 and $1.90 for the interim.
This is a brief analysis for the next day or so. Our weekly Natural Gas Commentary and daily updates are much more detailed and thorough energy price forecasts that cover key natural gas futures contracts, calendar spreads, the UNG ETF, and several electricity contracts. If you are interested in learning more, please sign up for a complimentary four-week trial.