Any company with substantial involvement in either the production or consumption of energy will always want to manage its energy price risk. Energy price fluctuations are a normal occurrence and can have a major impact on a company’s bottom-line. Therefore, company’s generally want to manage this risk in an effective way so that they can protect their investments. With this, the question arises, how does one manage price risk? The simple answer to this is the use of energy hedging and an energy risk management plan that can enable the company to meet its risk appetite goals.
Understanding the Difference between Speculative Trading and Hedging
It is very important that the difference between energy risk management, or energy hedging, and speculative trading be understood. Although hedgers and speculators are basically both placing trades their long-term goals are much different.
Speculative traders don’t produce or consume large quantities of energy. They are only concerned with placing trades in the direction of market trends and generating profit based upon those moves. Their holding period may be minutes, to days, to weeks, or more and their strategies vary greatly.
The end goal of a hedger is to protect the price of energy that is being produced or consumed by their company. For example, a producer wants to ensure that they get the highest price possible for commodities like crude oil or natural gas. Therefore, when prices are high and favorable, they use futures or derivates to lock in the price of their products for several months or even years.
Forming an Energy Hedging Strategy
A hedging strategy is the most crucial part of an effective energy risk management program. It can have long-term implications and help define the bottom line of a company’s yearly profit margins.
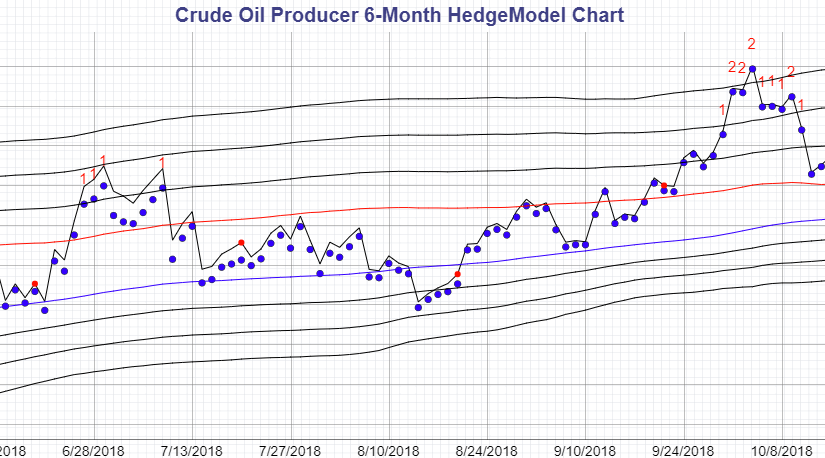
To arrive at the right decisions for your company the best way forward is validation by statistically analyzed data. To obtain this data you can turn to data analysis tools that an energy hedging solutions company of good standing can provide you. The company you choose will also provide you with a comprehensive series of charts and models to enable the study and monitoring of long-term price cycles.
The consultant will then guide you on how to use these price cycles to time hedges. The charts will give better insights on when to hedge, how much to hedge, and what types of instruments to use. In this way, you’ll be able to use the data that was collected by studying the charts and convert it into valuable information that will help mitigate the risks of price fluctuations in the energy markets.
Using Reports and Forecasts
Any effective energy risk management program should fit in with the hedging company’s goals and risk appetites. Reading the reports provided by a good energy hedging and risk management consultant can be of great help in this case. Ideally, these reports should offer you a quarterly forecast of the energy markets and should contain everything from the future curves in terms of energy pricing to recommendations on the right instrument to use for your hedges.
Valuable Rules to Remember
To successfully carry out an energy hedging program you should consider some general rules. Hedge when the opportunity presents itself, not based on a specific fiscal or calendar year or long-term price forecast. Opportunities occur when strips are at extremes. Choose to not hedge the first nearby contract and often postpone the second and third. Hedge for a longer duration like six months to a year or more, because it often takes this amount of time for a market to revert to its price mean. Lastly, fix forward in small increments, instead of one lump, over a three-to-four-month time span.
Conclusion
A carefully formed energy hedging strategy based on statistically analyzed data can enable companies that produce or consume energy to mitigate risks in the highly volatile energy markets.