Natural Gas Technical Analysis and Near-Term Outlook
Natural gas is settling into a trading range as expected. Near-term technical factors are well balanced, and the narrowing range is forming a coil pattern. In this case, the coil is taking shape after a decline, so odds would normally favor a break lower out of the pattern. However, coils are not the most reliable patterns in regard to predicting a directional breakout. Coils reflect uncertainty, which is currently the case for natural gas as it sorts through conflicting short-term bullish and bearish external factors (weather forecasts, hurricane shut-ins/demand destruction, LNG demand, falling production, etc.).
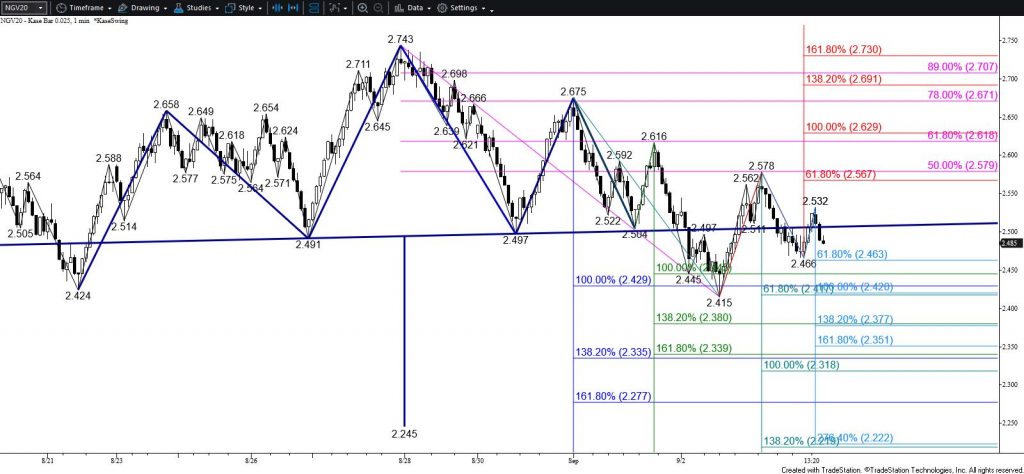
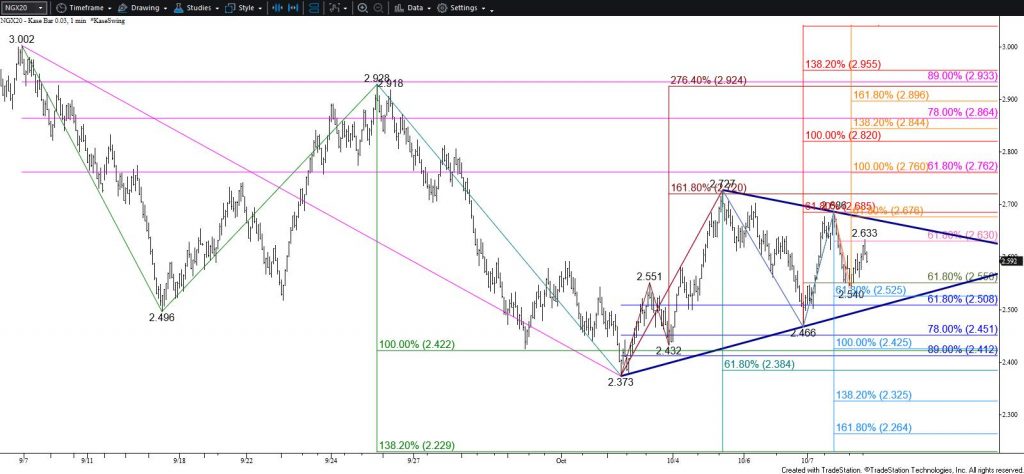
This afternoon’s move is a good example of the recent indecisiveness. After rising to challenge the smaller than (0.618) target of the wave up from $2.373 at the $2.686 swing high, prices fell to test the smaller than target of the wave down from $2.727 at the $2.540 swing low. This was also the 62 percent retracement of the rise from $2.466. The subsequent move up to $2.633 stalled at the 62 percent retracement of the decline from $2.686.
With that said, natural gas will likely remain range-bound for another day or two. During that time, the waves that form should help determine the direction of the pending coil breakout.
For now, based on this afternoon’s decline from $2.633, odds lean in favor of testing coil’s lower trendline around $2.54 early tomorrow. This level will probably hold, at least initially. Nevertheless, a close below $2.54 will call for $2.46, which then connects to key lower support at $2.40.
Conversely, should natural gas fail to reach $2.54 before overcoming $2.67 a short-fall within the coil will form. This is a bullish signal that triggers when prices within a pattern like a coil fail to test a trendline, in this case, the lower trendline around $2.54. Settling above $2.67 will call for key resistance at $2.76, which then connects to $2.83 and higher.
This is a brief analysis for the next day or so. Our weekly Natural Gas Commentary and daily updates are much more detailed and thorough energy price forecasts that cover key natural gas futures contracts, calendar spreads, the UNG ETF, and several electricity contracts. If you are interested in learning more, please sign up for a complimentary four-week trial.