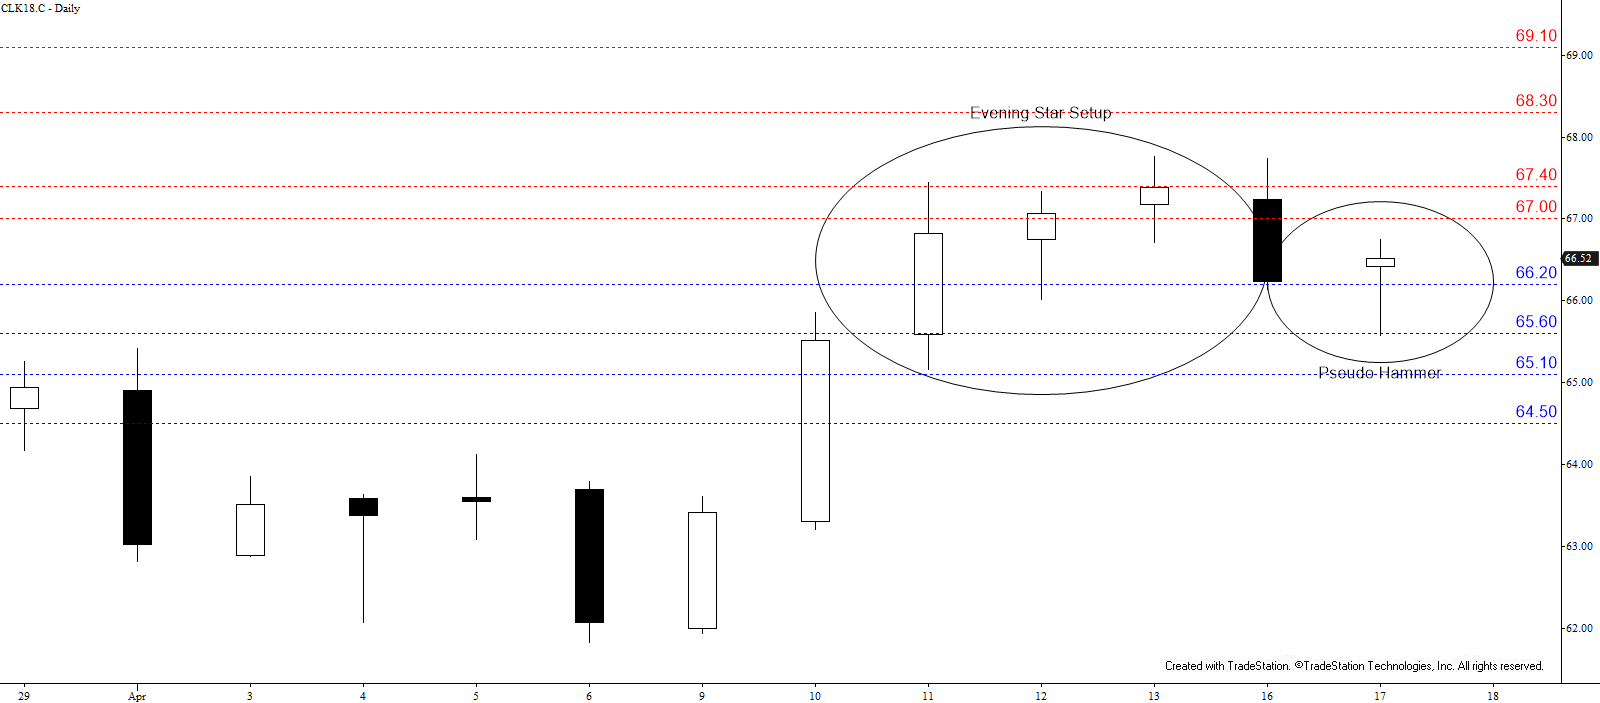
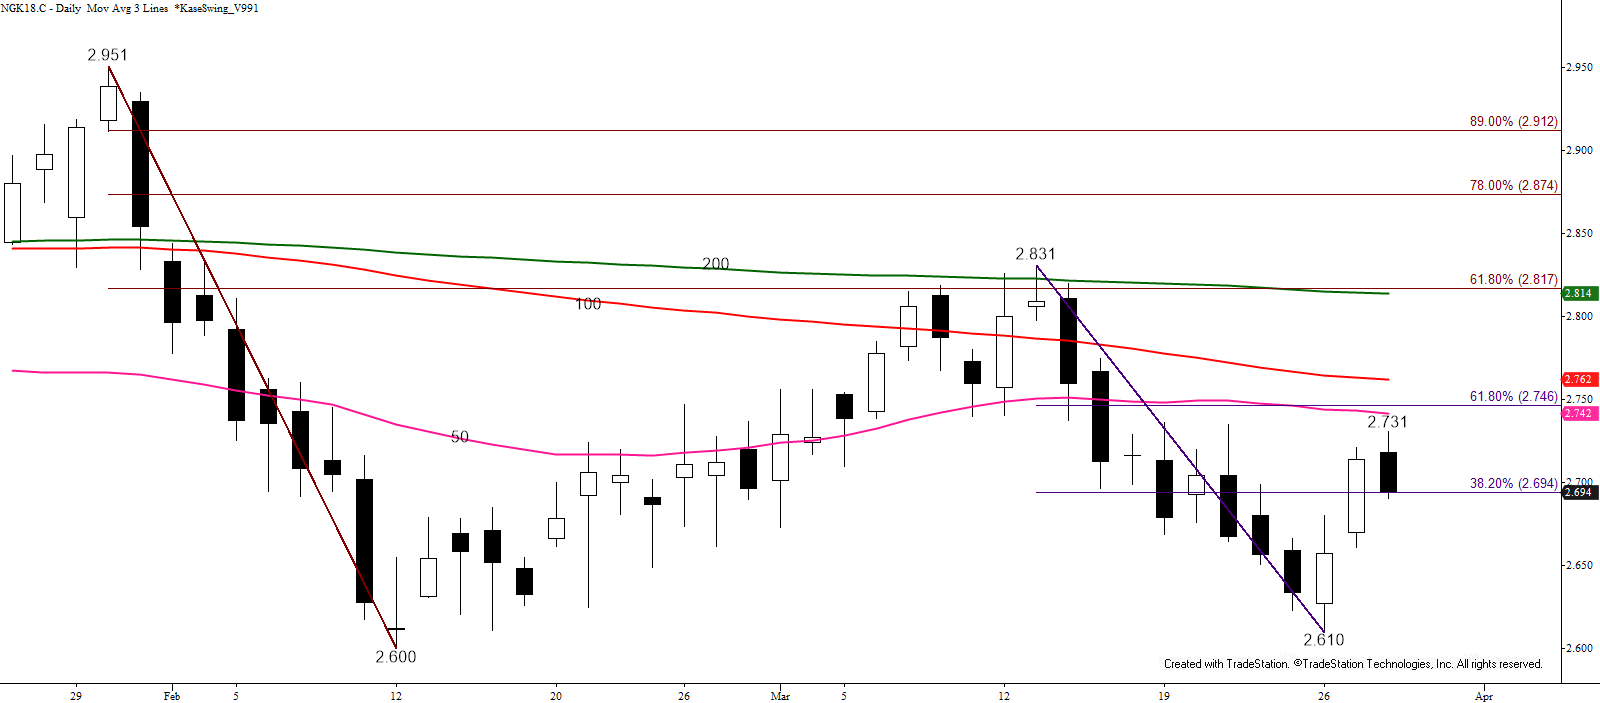
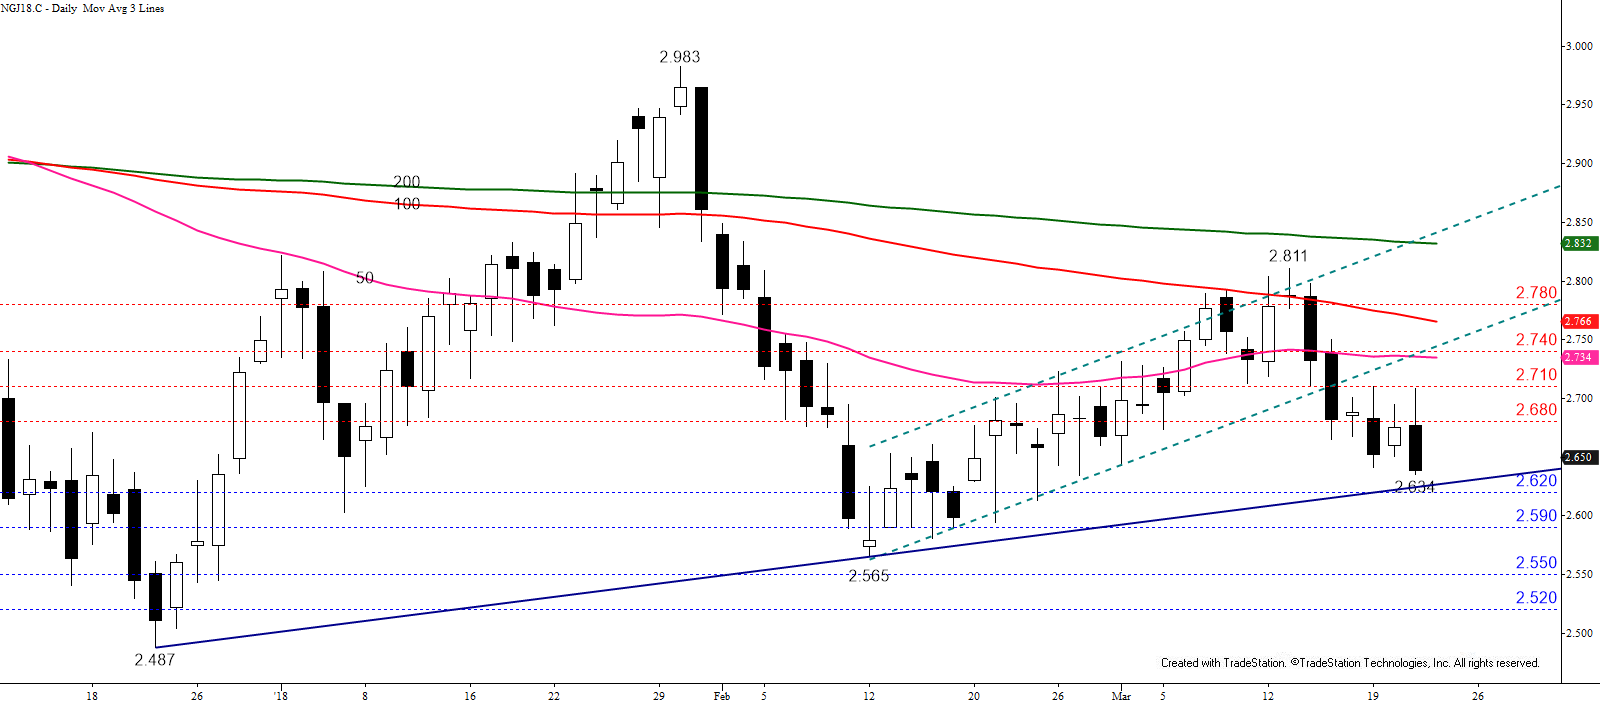
In the bigger picture, natural gas remains range bound between nominally $2.60 and $2.84. However, last Friday’s break higher out of a bullish flag and test of resistance at $2.76 set prices up to test the upper end of the trading range this week. So far, though, prices have struggled to reach the upper end of the range and the last three days form stars. Two, including the most recent, are shooting stars and the third is a hanging man. All three stars are part of an evening star reversal pattern setup that would be completed by a close below $2.71.
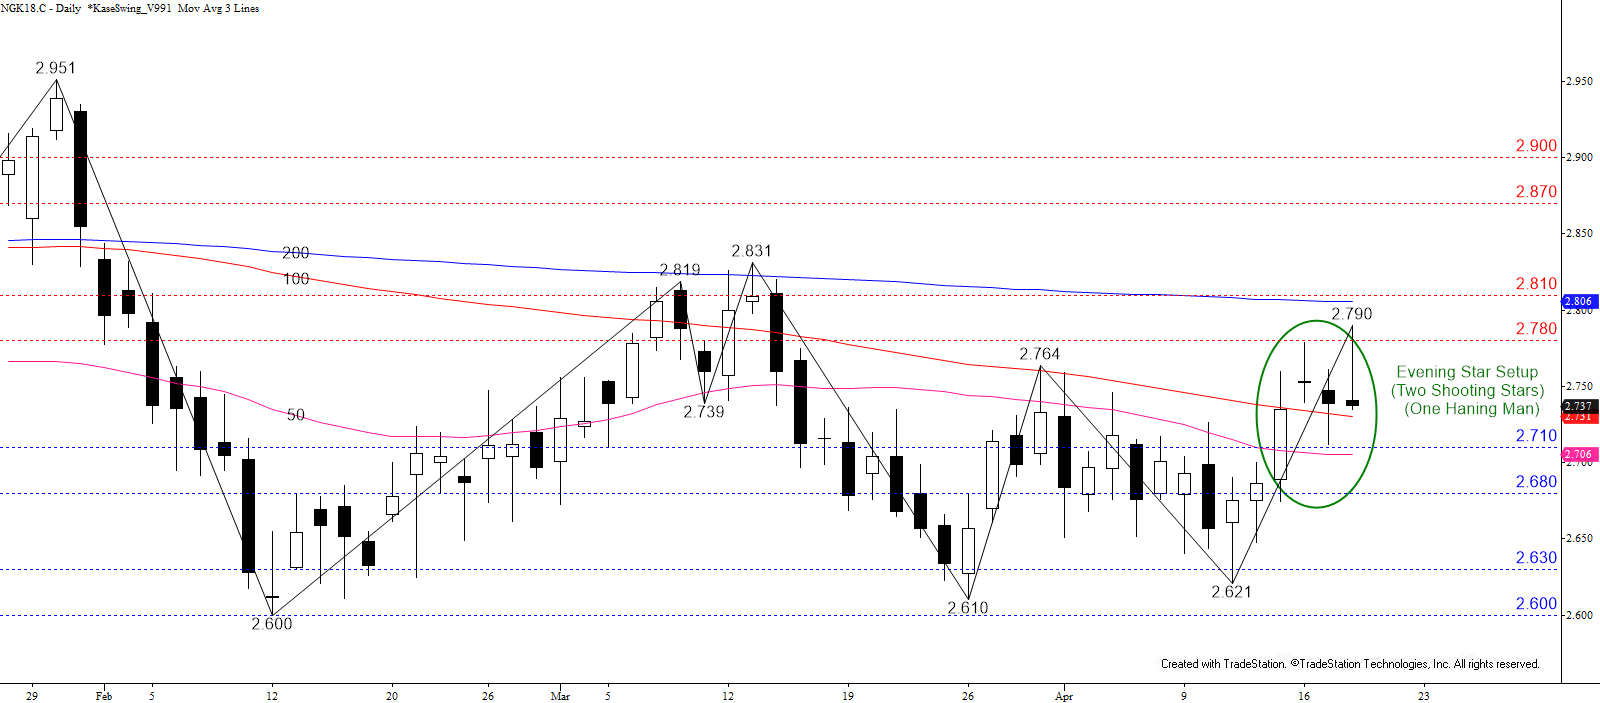
Given the shooting stars, hanging man, evening star setup and several bearish intra-day momentum divergences near-term odds favor another test of $2.71. As stated, a close below this would complete the candlestick reversal pattern and open the way for the confirmation point near $2.68. This is key support for the near-term because it is also the 62 percent retracement of the move up from $2.621. Settling below $2.68 would open the way for another test of the bottom of the recent trading range at $2.60.
That said, trading has been erratic and so far $2.71 has held after being tested on Monday. Should prices rise above $2.78 first, look for another attempt at $2.81 and even $2.87, resistance levels split around the upper end of the range at $2.84.
This is a brief analysis for the next day or so. Our weekly Natural Gas Commentary and daily updates are much more detailed and thorough energy price forecasts that cover key natural gas futures contracts, calendar spreads, the UNG ETF, and several electricity contracts. If you are interested in learning more, please sign up for a complimentary four-week trial.