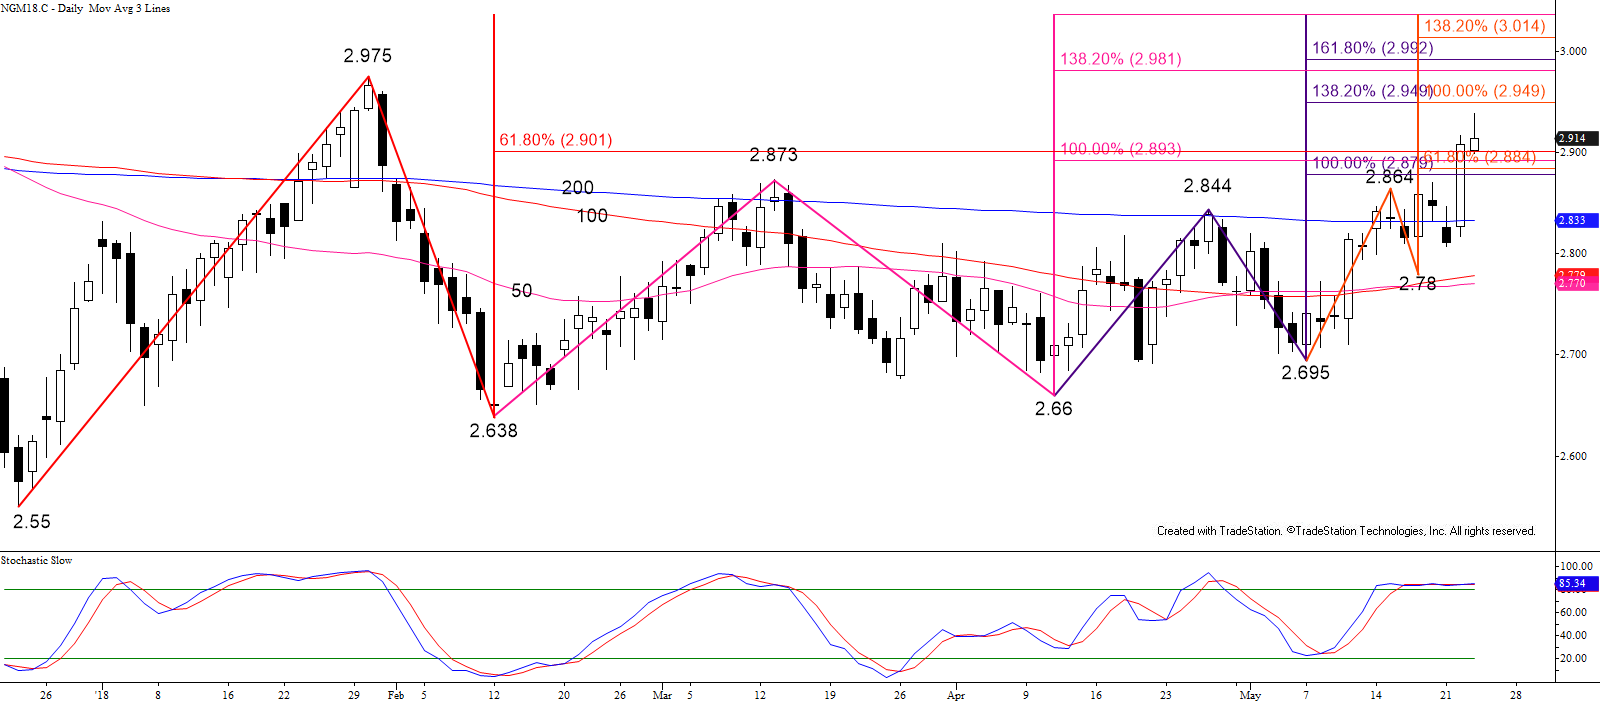
WTI Crude Oil Correction Poised to Extend

WTI crude oil rose for a second straight day due to the declining dollar. The long-term bias is still negative, so the move up is corrective. However, mixed fundamental and technical factors indicate the correction should extend to at least $48.2 before settling into another trading range. This is the 1.00 projection for the wave up from $44.03 and the 38 percent retracement of the decline from $54.0. A close over $48.2 would call for $50.4, the 1.618 projection and the 62 percent retracement. Look for immediate support at the $45.33 and $44.77 swing lows.

Take a trial of Kase’s weekly energy forecasts.

WTI Crude Oil

During the calendar month of March the April natural gas futures contract has traded in a range bound between $2.64 and $2.87. Most fundamental and technical factors are still negative for the long-term. The move up at this point is still corrective and will only delay the inevitable decline that is ultimately coming. However, late winter weather concerns continue to support the market and have rattled the nerves of traders enough over the past two days to push natural prices above $2.87 to challenge key resistance at $2.89 ahead of tomorrow’s U.S. Energy Information Administration (EIA) Natural Gas Weekly Update.

The market is hinting that a bullish EIA update may be expected, but if the number is disappointing, this natural gas price rise will collapse in upon itself and could be the catalyst the finally push prices lower to challenge key support targets.

The wave formations up from $2.589 (not shown), $2.641, $2.662, and $2.674 all show that $2.89 is a confluent wave projection. It is also the 62 percent retracement from $3.045 to $2.641. The confluence of wave projections and retracements at $2.89 make it the key decision point for an extended correction to at least $3.00 and possibly $3.07. At the time of this analysis, natural gas prices are trading right at $2.89, but they will need to settle above this to open the way for $3.00 in early trading tomorrow before the EIA update is released. Unless the EIA report is extremely bullish, it is doubtful that prices will settle above $3.07 in coming days.

natural gas forecast

Look for support at $2.78. This is in line with the $2.775 swing low, the midpoint of the recent range between $2.64 and $2.87, and the midpoint of the March 12 and 17 candlesticks. A close below $2.78 would indicate the move up has failed to extend once again.

Take a trial of Kase’s in-depth weekly energy price forecasts.

April gasoline prices fell for the fourth day in a row, but held support at 185.0. The bearish KaseCD divergence and underlying short permissions (red dots) indicate the decline should continue to 180.0. A normal correction will hold 180.0 because it is the 38 percent retracement of the move up from 149.64 and the 1.618 projection for the intraday wave down from 198.93 (not shown). A close below 180.0 would call for the 62 percent retracement at 168.5. This level must hold for gasoline prices to retain any chance at a continued recovery in the near term.

Learn more about Kase’s energy forecasts.

gasoline prices

Cold weather continues to support natural gas, but the wide sweeping frigid conditions have not been enough of an influence to drive prices higher. Fundamental and technical factors leave little doubt that the outlook for the next several months is bearish, but for now, natural gas prices are stuck in a trading range bound between approximately $2.55 and $3.00.

Prices fell last week after the disappointing U.S. Energy Information Administration (EIA) Natural Gas Weekly Update, and a swing low of $2.641 was made on Tuesday. The $2.80 midpoint of last Thursday’s candlestick held Wednesday morning, which may be an early indication that another disappointing EIA update is expected tomorrow. The $2.80 level is confluent resistance because it is also the 38 percent retracement of the decline from $3.045 to $2.641.

There are a few short term positive factors (green arrow and triangle) triggered by KaseX on the $0.05 KaseBar chart, and a close over $2.80 would open the way for key resistance at $2.90. The $2.90 level is the 62 percent retracement from $3.045 and the 0.618 projection for the wave $2.589 – 3.045 – 2.641. This is crucial, because waves that overcome the 0.618 projection typically extend to at least the 1.00 projection, in this case $3.10. We expect $2.90 to hold, but a close over this level would shift near term odds in favor of another attempt at $3.10 and higher.

Natural Gas Forecast

First support is $2.70, and a move below this would call for the $2.641 swing low and $2.589 contract lows to be challenged. The most important target is still $2.55, because the technical show that it is the gateway objective for a decline into the low $2s. It will likely be at least a few more weeks before prices close below $2.55.

So for now, our analysis leads us to believe that a near term test of resistance at $2.80 and possibly $2.90 will take place, but that $2.90 will hold and prices will continue to oscillate in a sideways range.

Kase Bars are available on TradeStation and Bloomberg.

Take a trial of Kase’s in-depth weekly Natural Gas Forecast or of KaseX.

Natural gas’s recent upward correction has been driven by cold weather, and still has a modest chance to extend. However, the key question that should be asked is how long will natural gas prices be able to sustain upward momentum once weather moderates? Several technical factors are already showing that the move up may be over, and that a continued decline may take place sooner than some might have expected.

The move up stalled at $3.045 on Monday morning. From a technical standpoint, this was a bit disappointing because the wave $2.589 – 2.891 – 2.681, which had previously met it 1.00 projection, failed to meet its 1.382 target at $3.098. This was especially negative because Monday’s decline and close below Friday’s $2.91 midpoint triggered a bearish Dark Cloud Cover (marked by the Kase Candles indicator’s pink dot and DarkC label). Dark cloud covers are reversal patterns, and the formation would be confirmed upon a close below Friday’s $2.852 open.

Natural Gas Prices

Subsequently, the attempted moves up on Tuesday and Wednesday have failed to close over the $2.94 midpoint of Monday. A close over $2.94 would negate the dark cloud cover, and open the way for another attempt at $3.098 and $3.17, the 1.382 and 1.618 targets for the primary wave up from $2.589, respectively. However, the failure to close over $2.94, so far at least, is negative.

The key for the down move will be a close below $2.85. As previously stated, $2.85 is the confirmation point for the dark cloud cover. It is also the 0.618 projection for the wave $3.045 – 2.839 – 2.974. Therefore, a close below $2.85 would call for at least $2.77. In our detailed weekly price forecast, $2.77 was pegged as the major decision point for a continued decline and retest of the $2.589 contract low. As shown by the blue wave extensions, at minimum, a close below $2.77 should clear the way for the 1.618 projection at $2.64.

Unless there is a shock from tomorrow’s U.S. Energy Information Administration (EIA) Natural Gas Weekly Update, it looks as though the move up has stalled, and that major test of support at $2.77 will take place in the next few days. The near-term outlook for natural gas prices is not yet technically bearish, but a sustained close below $2.77 will help to shift the bias strongly in that direction.

Take a trial of Kase’s Weekly Natural Gas Price Forecast.

Most technical factors now indicate that WTI’s upward correction has failed and that the near term WTI price outlook is negative again. Monday’s decline broke the lower trend line of a bullish ascending wedge. Formations like this break higher around 75 percent of the time, so failures like this do not generally bode well for a continued price rise.

More importantly, WTI prices are about to take out the crucial $48.2 swing low. This level is important because it is the 1.00 projection for the wave $55.05 – 48.2 – 54.92, the 62 percent retracement from $44.37 to $55.05, and the key swing low for the upward wave formation from $44.37. Taking out $48.2 would call for at least $45.5, and very likely to $43.8 and lower.

The only real hope for a continued WTI price rally in the near term would be for prices to hold $48.2. Look for resistance at $51.0 and $52.5. A close over $52.5 would call for another test of the triple top of $55.0.

For a more in-depth analysis, take a free trial of Kase’s weekly crude oil price forecast.

wti price


WTI crude oil is trying desperately to show that a bottom has been made and that a recovery is underway. WTI is testing a crucial decision point at $54.0. This is the 0.618 projection for the wave, $43.58 – 54.24 – 47.36. Most waves that meet the 0.618 projection extend to at least the 1.00 projection, in this case, $58.0. However, a pullback will usually take place first.

Support at $49.9 should hold, but the $47.36 swing low is the level that must hold for the near-term outlook to remain positive. A close below this would negate the wave up from $43.58, and call for a continued decline.

Take a free four week trial of Kase Energy Price Forecasts.

CLH5

For several weeks $2.79 was major support for natural gas. This level was tested many times, and was finally broken after last week’s bearish U.S. Energy Information Administration (EIA) Natural Gas Weekly Update.

Subsequently, prices have fallen to a $2.608 contract low, and $2.79 has become near-term resistance. The $2.79 level is the completion point for a bullish morning star setup, and was tested on Tuesday when prices rose to $2.783. This level is expected to hold for at least the next few days.

NGH5

As of this analysis, Wednesday’s decline has setup a pseudo bearish engulfing line. The bearish engulfing line and other technical factors indicate another bearish EIA number may be expected tomorrow.

Trading will likely be extremely choppy over the next few days, but look for $2.79 to hold and for prices to challenge the $2.608 swing low. Ultimately, the decline is expected to extend to the next major target and bearish decision point at $2.52.

Conversely, a close over $2.79 in the next few days would complete the bullish morning star setup and open the way for an extended correction to the $2.852 confirmation point.

For more information about Kase StatWare please visit the Trading Indicators Page. To take a free trial of Kase’s weekly energy forecasts please visit the Energy Price Forecasts Page.

NY Harbor ULSD future’s upward correction extended to 177.7 on Monday. The primary wave 158.9 – 171.7 – 160.5, met its 1.382 projection at 177.7 and is poised to extend to the 1.618 projection of 184.2. This is the decision point for an extended correction and potential recovery. Although it is too early to say that a bottom has been made, a sustained close over 184.2 would open the way for 198.7 and 217.7. A close below 164.3 would indicate the upward correction is complete and call for 153.2 and lower.

To learn more about Kase’s forecasts please visit the Energy Price Forecasts Page.

HO


Last week’s natural gas price rise was poised to fill December 22nd’s gap from $3.48, but the upward correction stalled at $3.352. The week settled above the $3.09 midpoint of Wednesday, January 12th’s candlestick, leading to speculation that the market might try to rise again early this week. However, Monday’s intraday gap down from $3.056 and settle back below $3.00 was negative for the near-term outlook.

There is still major support at $2.80 that has held so far, but after this morning’s move up stalled and failed to fill to $3.056 gap it looks as though a bearish U.S. Energy Information Administration (EIA) Natural Gas Weekly Update is expected tomorrow.

The key wave for the short-term is $3.352 – 3.024 – 3.228. This wave has already fallen below its 1.00 projection at $2.90 and is poised to meet at least its 1.382 projection at $2.77. This then connects to $2.66 as the 1.618 projection. The $2.66 target is highly confluent for many of the larger and earlier waves down, and is the 0.618 projection for the wave $3.95 – 2.783 – 3.352. The confluence is important because a sustained close below $2.63 would open the way for a decline into the mid-to-low $2’s over the course of the longer-term. Therefore, $2.63 is a potential stalling point for the decline.

nat gas

The KaseX indicator on the 240-minute equivalent Kase Bar (KBAR) also confirms the negative outlook and has generated several short signals (purple arrows) during the decline from $3.352. The most recent short signal came after the $3.015 swing high this morning. At this point, there are no warning signals that indicate profit should be taken or that short trades should be exited. This will likely change though should prices recover above the $3.015 swing high.

First resistance ahead of the EIA report is $3.06, which is near the top of the $3.056 gap. A move above this would call for 3.15, which is the 0.618 projection for the wave $2.783 – 3.352 – 2.821. The $3.15 level is confirmed as the 62 percent retracement from $3.352 to $2.821. It is also interesting to note that this morning’s rise to $3.015 stalled just below the 38 percent retracement at $3.02. This is another negative factor.

To summarize, the bias is negative, and the move down is expected to continue. There is strong support at $2.80, but a move below this would call for at least $2.77 and very likely $2.66. Resistance at $3.06 will likely hold, but a move above that would open the way for at least $3.15.

For more information about KaseX please visit our Trading Indicators Page. To take a trial of Kase’s in-depth weekly energy forecasts on natural gas and crude oil please visit the Energy Forecasts Page.