WTI Crude Oil Technical Analysis and Short-Term Forecast
This is a brief analysis for the next day or so. Our weekly Crude Oil Forecast and daily updates are much more detailed and thorough energy price forecasts that cover WTI, Brent, RBOB Gasoline, Diesel, and spreads. If you are interested in learning more, please sign up for a complimentary four-week trial.
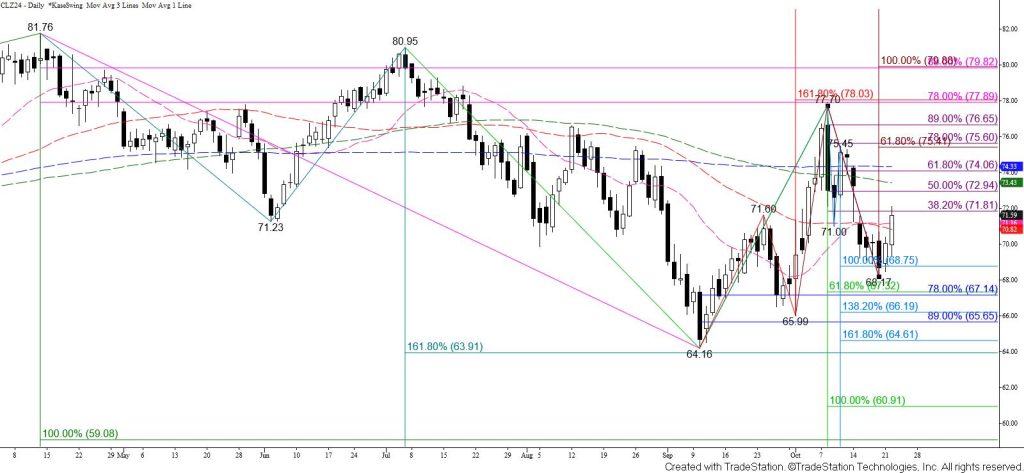
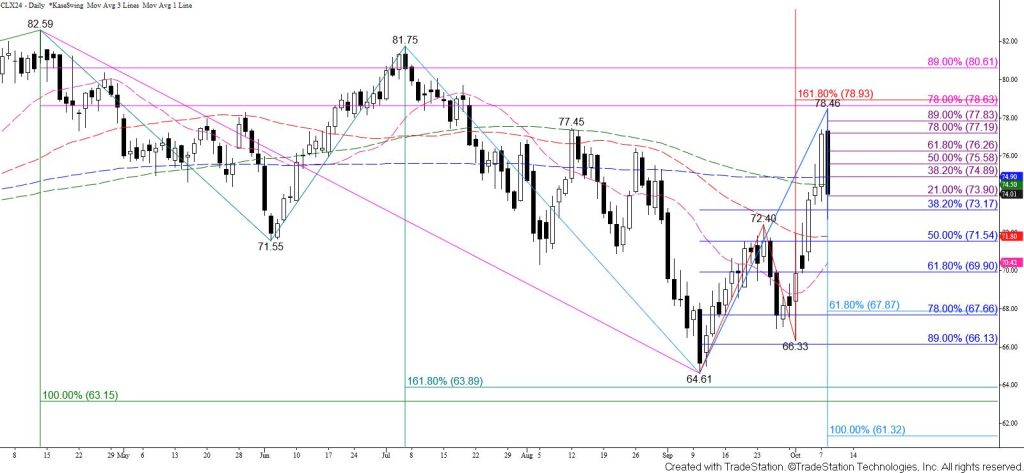
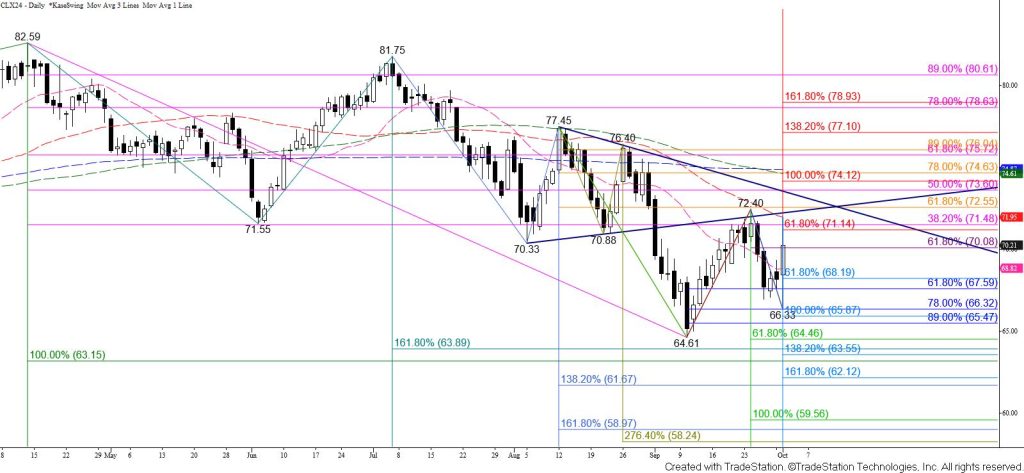
WTI crude oil continued to rise on Tuesday as called for in Monday’s update and settled above the 20- and 50-day moving averages. The 38 percent retracement of the decline from $77.7 at $71.8 held on a closing basis. Even so, the move up during the past two days reflects a bullish shift in near-term sentiment and warns that another significant test of resistance is underway.
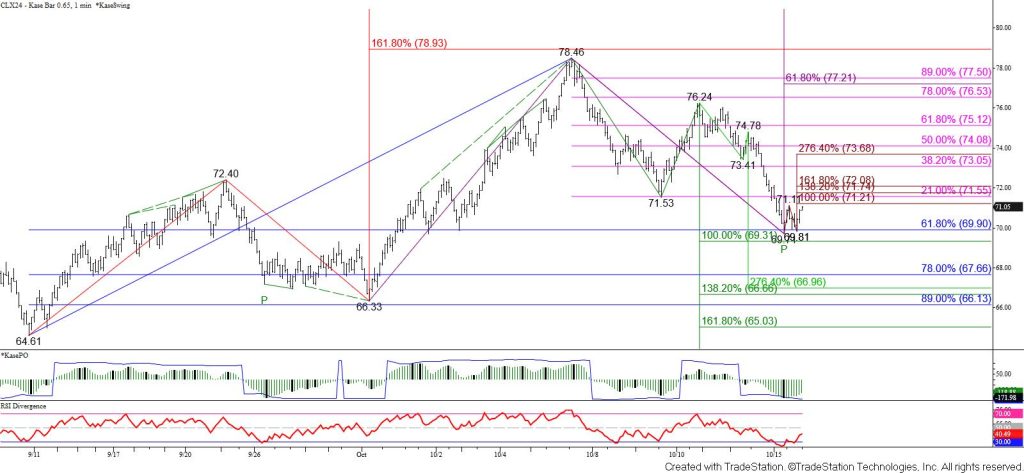
The intra-day wave formation up from $68.17 calls for a test of 72.4 and possibly the 50 percent retracement at $72.9. Settling above $72.9 will call for major resistance at $74.2 to be challenged in the coming days. This is the 62 percent retracement and 200-day moving average. Settling above $74.2 will imply that the move down from $77.7 is complete.
That said, a normal correction will continue to hold $71.8. A bearish KasePO divergence and short warning entry signal on the $0.35 Kase Bar chart also warn that the move up from $68.17 might be complete. However, to confirm this, prices will have to settle below the 62 percent retracement of the rise from $68.17 at $69.7.