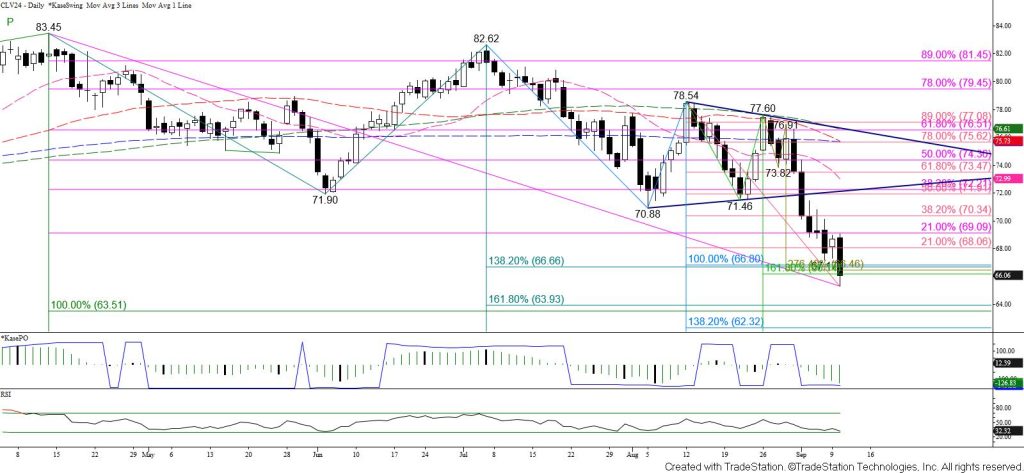
WTI Crude Oil Technical Analysis and Short-Term Forecast
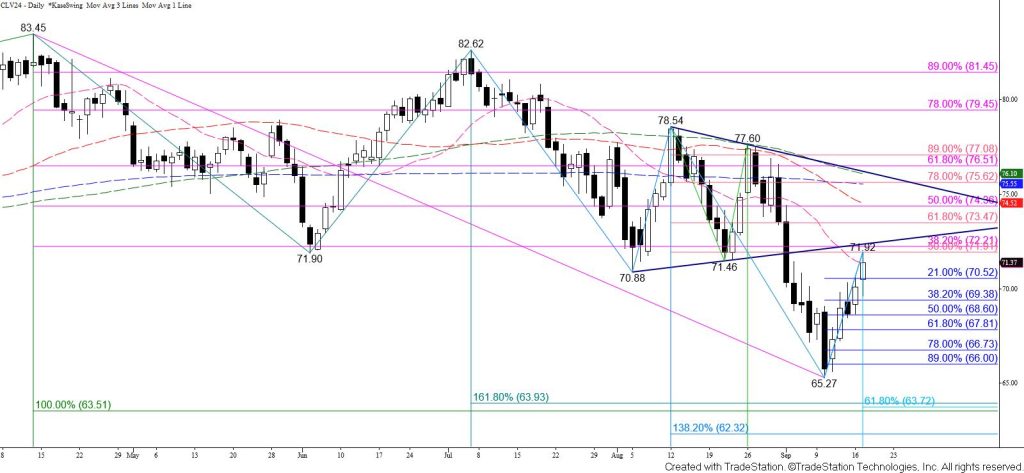
November WTI crude oil briefly rose above the lower trend line of a coil pattern that broke lower on September 3. Prices settled below this trend line but closed above the 38 percent retracement of the decline from $82.59. This target at $71.5 had held on a closing basis for a few days. This was bullish for the outlook and suggests that another test of the coil’s lower trend line at $72.3 will take place tomorrow. There is also a good chance for a test of $72.8, which sits just above the 62 percent retracement of the decline from $77.45.
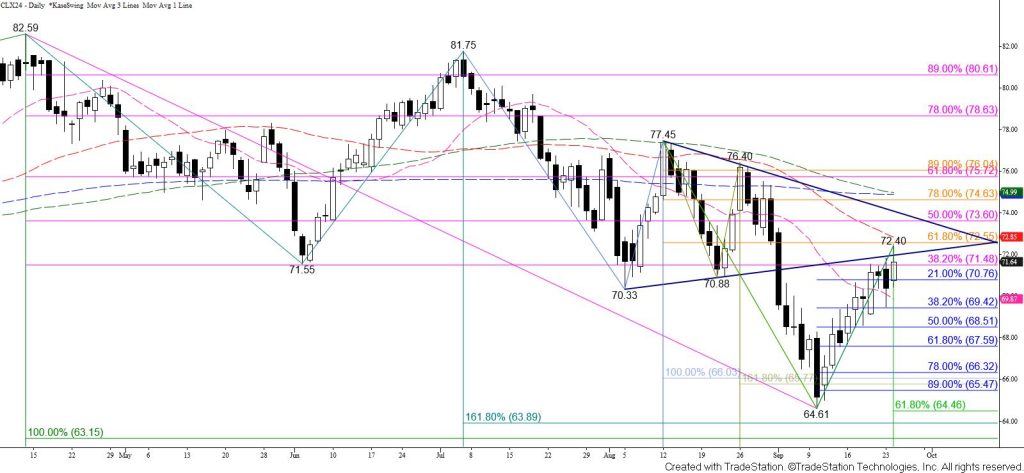
The $72.8 target is most important because this objective is in line with the lower trend line of a wedge pattern on the continuation chart that broke lower during the week ended September 6. A sustained close above $72.8 will confirm that a bullish reversal is underway.
Settling above $72.8 will also call for a test of the $73.6 confirmation point of a weekly long-legged doji on the continuation chart. The $73.6 target is also November’s 50 percent retracement of the decline from $82.59.
That said, should $72.8 continue to hold there is still a modest chance that the move up is a corrective throwback on the continuation chart. In this scenario, settling below the 38 percent retracement of the rise from $64.61 at $69.4 would warn that the move up is failing and put the near-term odds in favor of testing the respective 50 and 62 percent retracements at $68.5 and $67.6.