WTI Crude Oil Technical Analysis and Short-Term Forecast
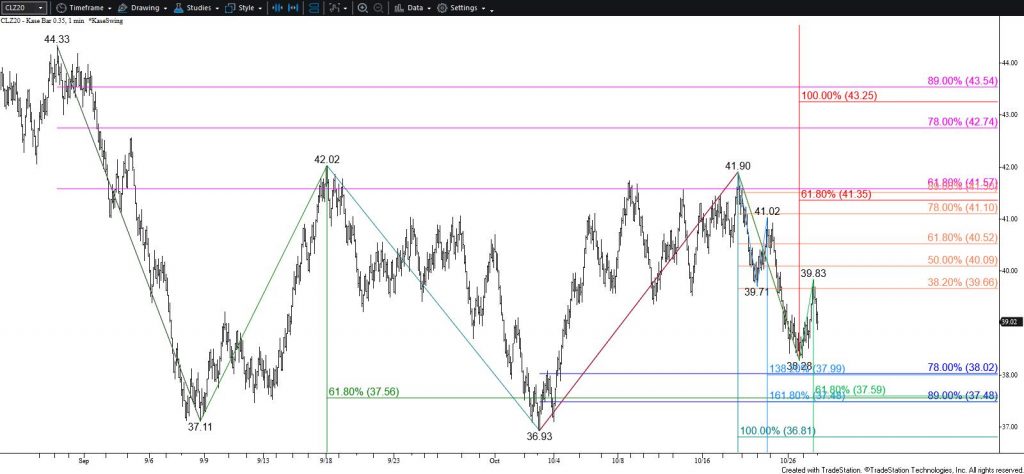
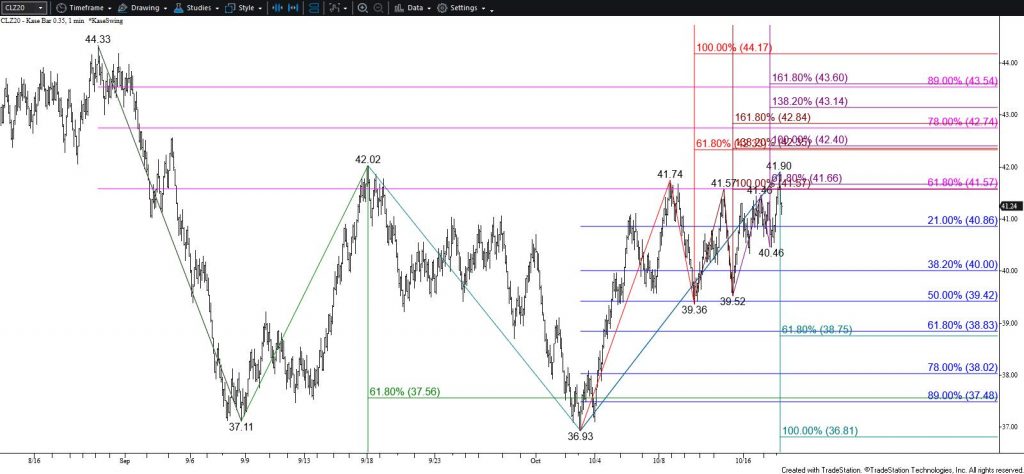
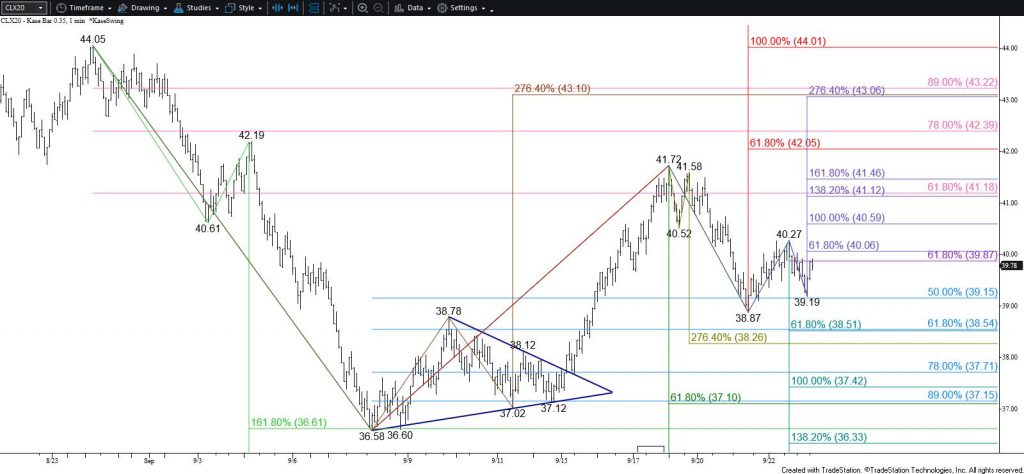
WTI crude oil has adopted a bullish near-term outlook after settling above $37.7, the 38 percent retracement of the decline from $44.33 and the 50 percent retracement from $41.90. This is also last week’s midpoint.
The move up is now poised to challenge a crucial near-term target at $38.8. This is the 50 percent retracement from $44.33 and the 62 percent retracement from $41.90. Closing above $38.8 would put odds in favor of challenging $40.2 and possibly another test of $42.0. The $42.0 objective defined the upper end of the range that December WTI traded in from early September until late last week.
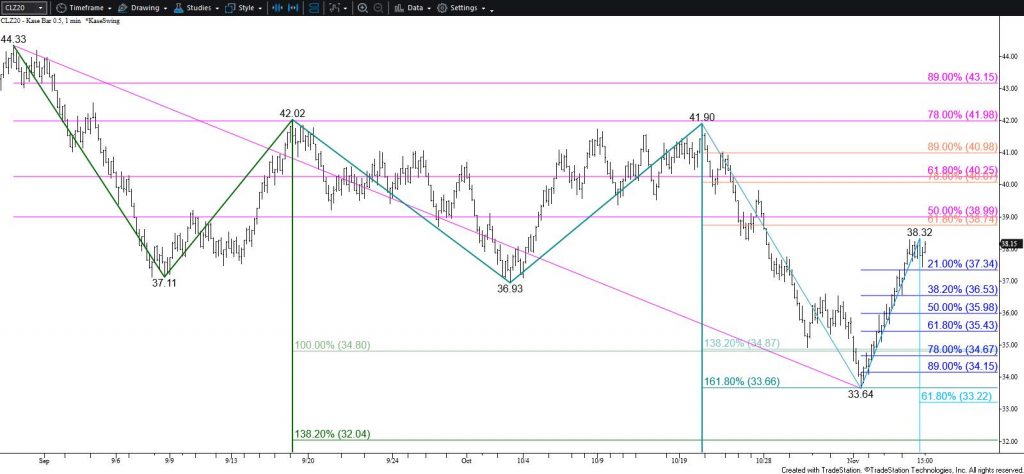
That said, the move up from $33.64 lacks a wave structure that can sustain a larger move up. There are no reversal patterns or signals as of this afternoon, but a test of support is anticipated before WTI rises much higher.
Should WTI turn lower early tomorrow look for initial support at $36.5 and then $36.0. Key near-term sport is $35.3. Closing below this will call for another test of $34.8, the equal to (1.00) target of the primary wave down from $44.33, which has held on a closing basis so far.
Brent Crude Oil Technical Analysis and Short-Term Forecast
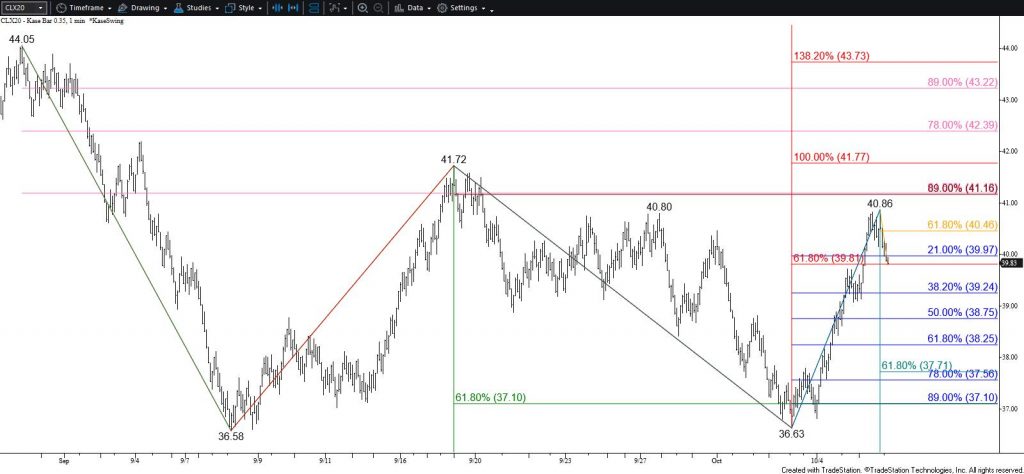
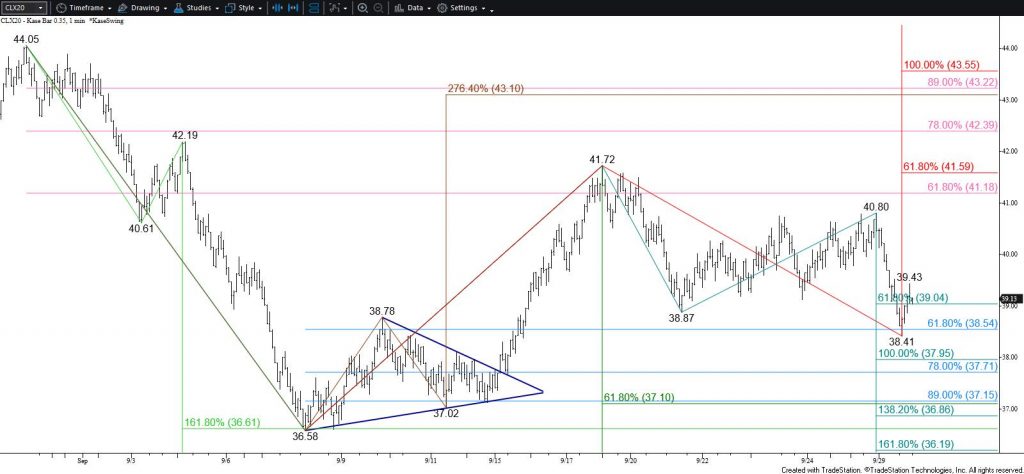
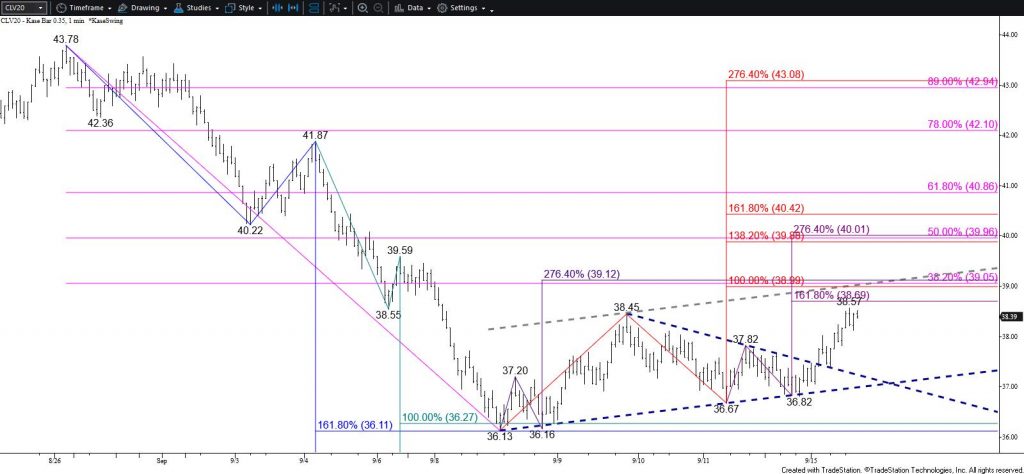
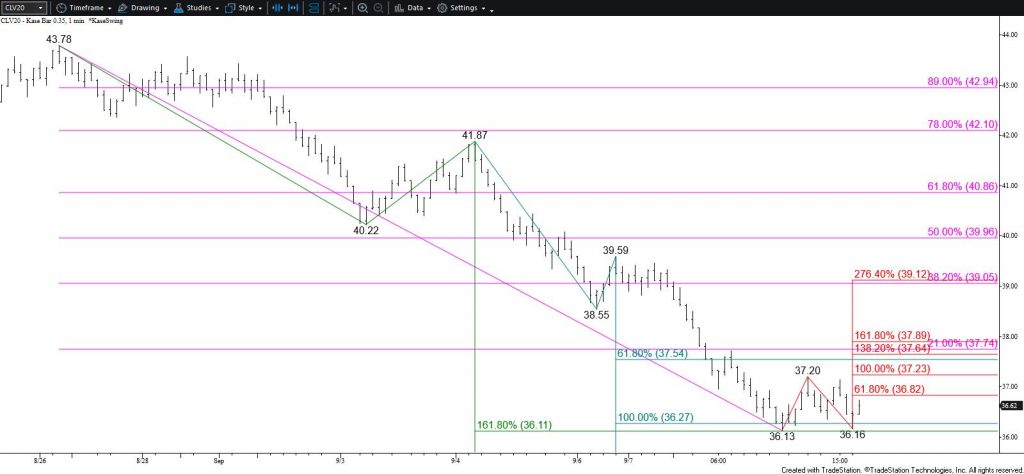
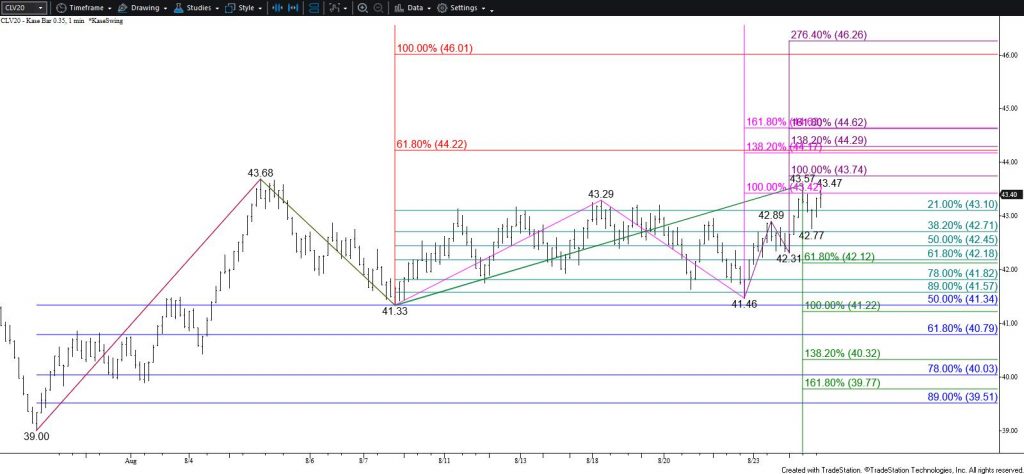
Brent tested and held $40.0 on a closing basis today. This was near the 38 percent retracement of the decline from $47.31. Even so, the move up is poised to continue because today’s close above last Thursday’s open confirmed Friday’s bullish high wave candlestick reversal pattern. Today’s move up also confirmed daily bullish KaseCD and KasePO divergences. Therefore, odds favor a continued rise to $40.8, a crucial near-term objective that connects to $41.5 and $42.9.
Nevertheless, Brent is due for a test of support before rising much higher. Holding $40.0 suggests such a move might take place early tomorrow. Support at $38.6 is expected to hold and $37.4 is key. Settling below $37.4 would shift near-term odds back in favor of a larger decline.
This is a brief analysis for the next day or so. Our weekly Crude Oil Forecast and daily updates are much more detailed and thorough energy price forecasts that cover WTI, Brent, RBOB Gasoline, Diesel, and spreads. If you are interested in learning more, please sign up for a complimentary four-week trial.