Crude oil prices continue to decline. Reports indicate the primary culprit is waning expectations for a meaningful OPEC output cut. In addition, some see record level production from countries like Russia and Canada as an equalizer to any cuts that may be made. There is also added uncertainty as US president-elect Donald Trump has pledged to loosen US drilling restrictions, which could boost domestic output next year.
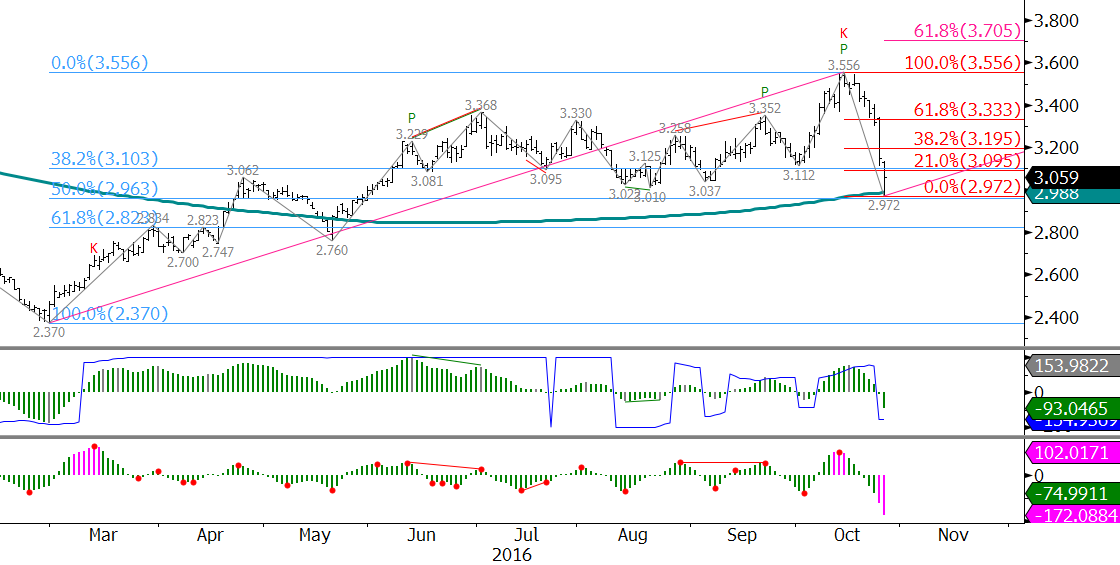
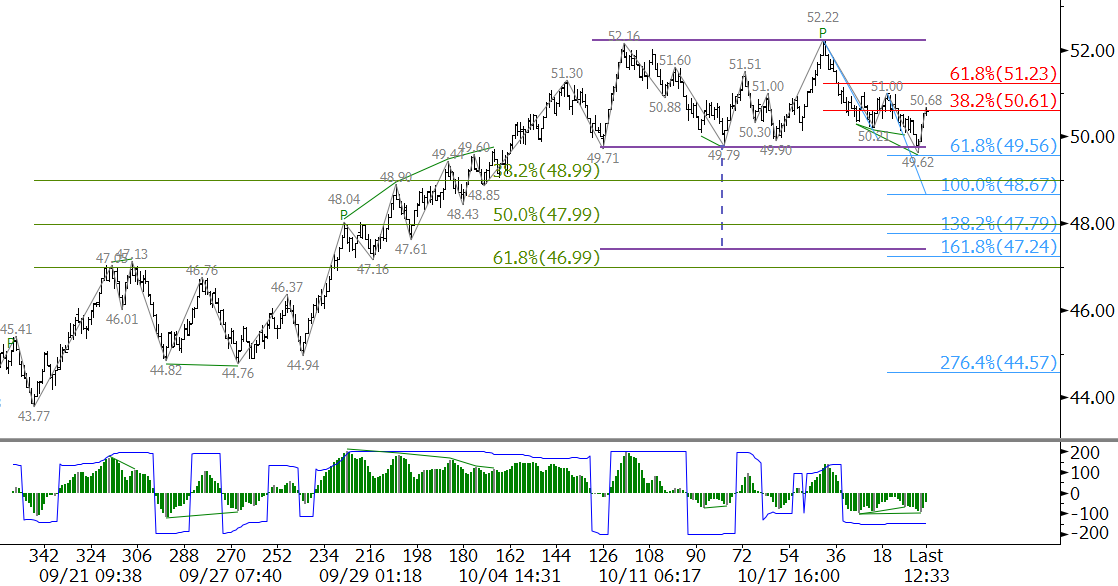
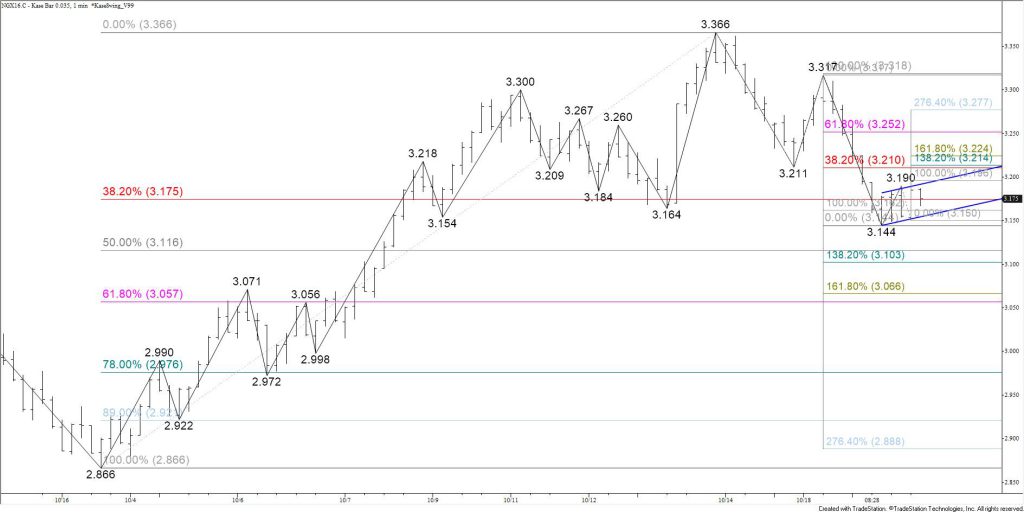
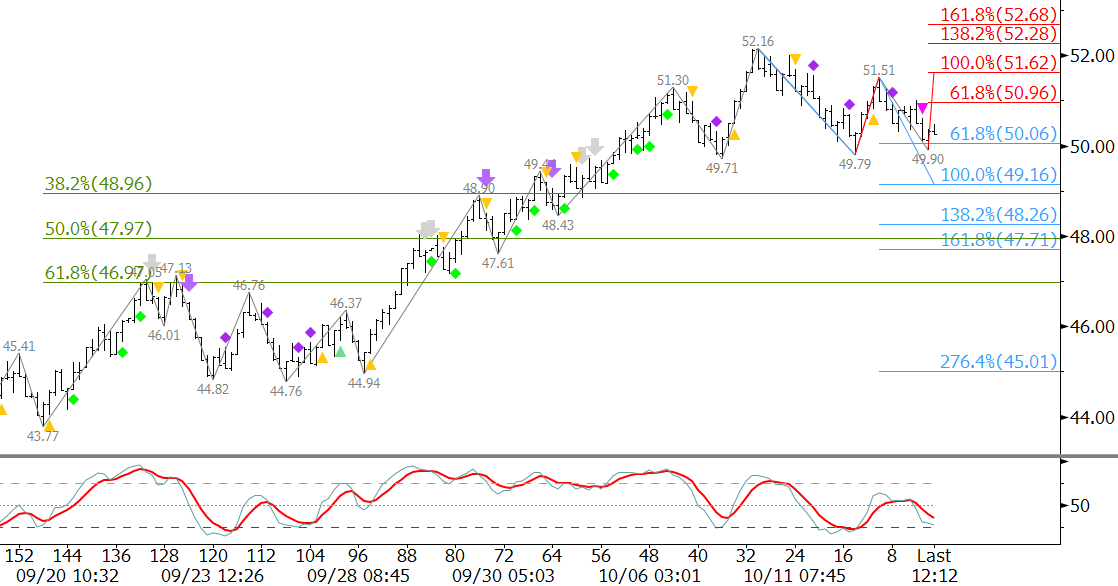
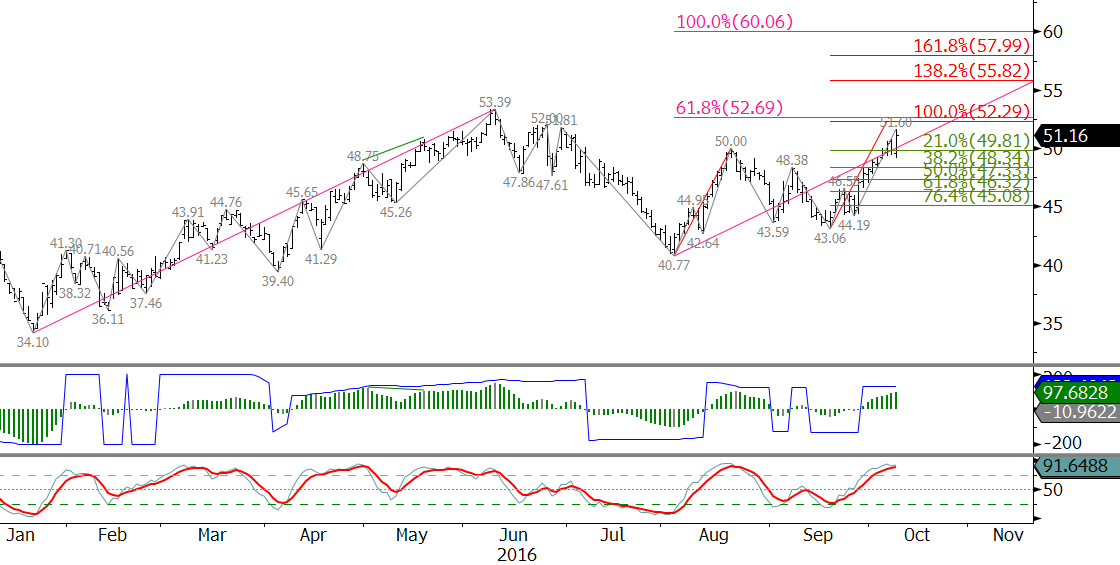
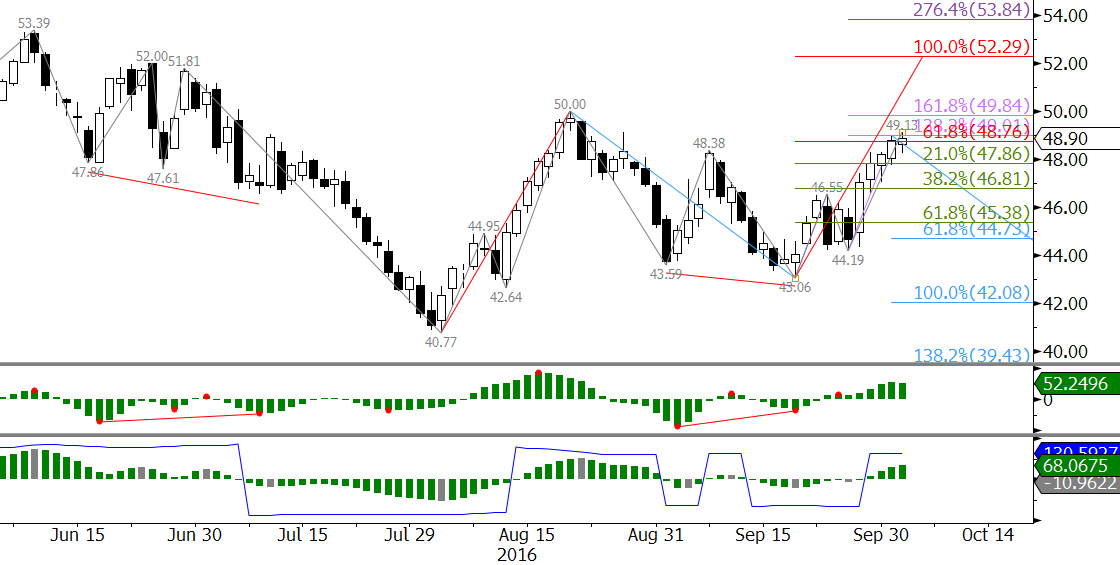
Most technical factors are also negative. December WTI crude oil is poised to challenge the $41.58 swing low made August 3. This is in line with the 62 percent retracement of the move up from $34.06 to $53.62. Key support is $40.0, the 1.00 projection of the wave $53.62 – 41.58 – 52.22. A close below $41.6 would call for a long-term bearish outlook. A close below $40.0 would open the way for potentially $35.6 and lower.
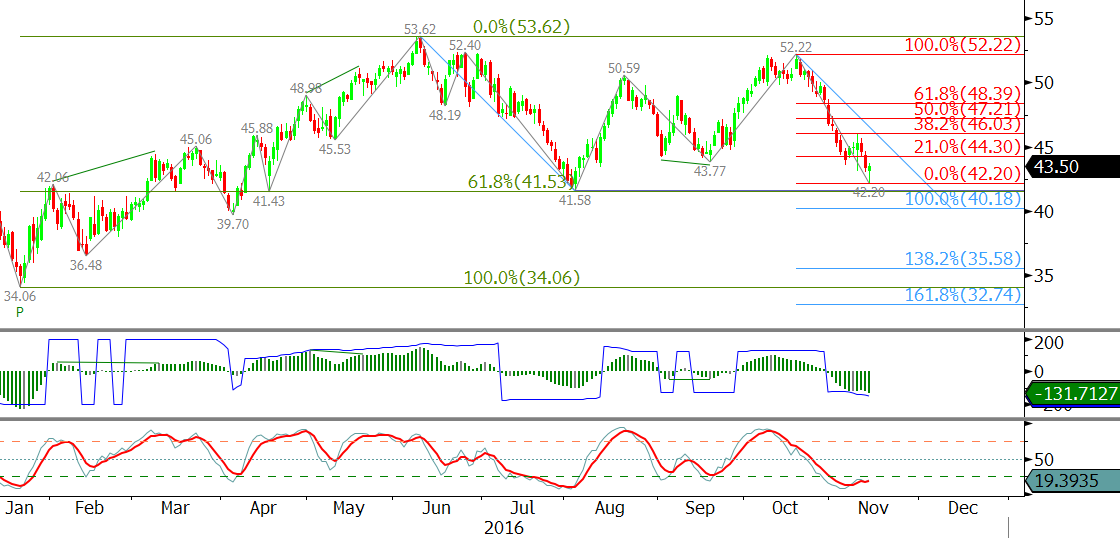
That said, on Monday the move down stalled at $42.2 and formed a bullish hammer. This is a reversal pattern setup that indicates the upward correction may extend first. The hammer’s completion point is $43.9 and the confirmation point is $44.4.
A close over $44.4 would call for a more substantial correction to $46.0. This is crucial resistance for the near-term because it is the 38 percent retracement of the decline from $52.22 to $42.2. Without a bullish shift in underlying factors, it is doubtful that $46.0 will be overcome.
This is a brief analysis and outlook for the next day or so (in this case, a bit longer). Our weekly Crude Oil Commentary and intra-week updates are a much more detailed and thorough energy price forecast. If you are interested in learning more, please sign up for a complimentary four-week trial.