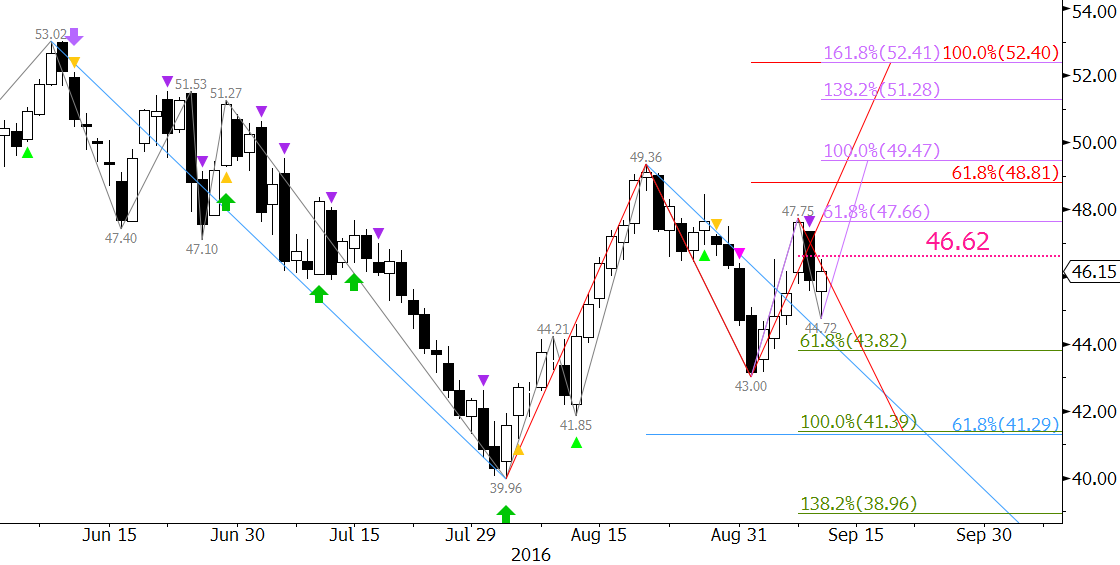
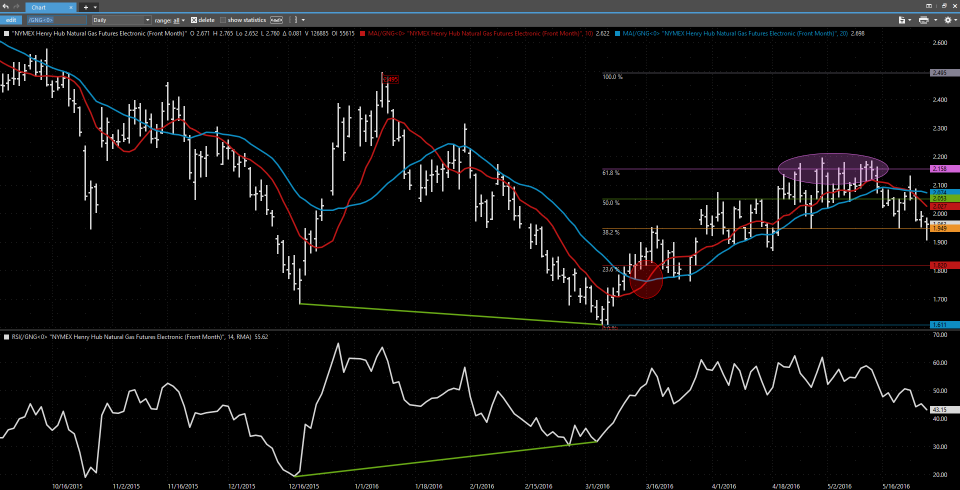
Natural gas continues to oscillate in an erratic and corrective range. After stalling near $3.00 on July 1, the prompt-month futures contracts have challenged the boundaries of a range between nominally $2.53 and $2.95. This is similar to the range that natural gas traded in for nearly nine months of 2015 before breaking lower in mid-September.
Longer-term, the outlook is positive and natural gas will likely rise to targets above $3.00 before the end of the year. However, since July 1 there has not been enough fundamental support to sustain a move above $3.00. The summer was hot this year, and demand was strong, but production kept pace. The market is well supplied and will likely end the injection season near or just above historically high storage levels as winter approaches.
Many long-term technical factors are positive, but there are short-term factors that indicate another test of support is looming.
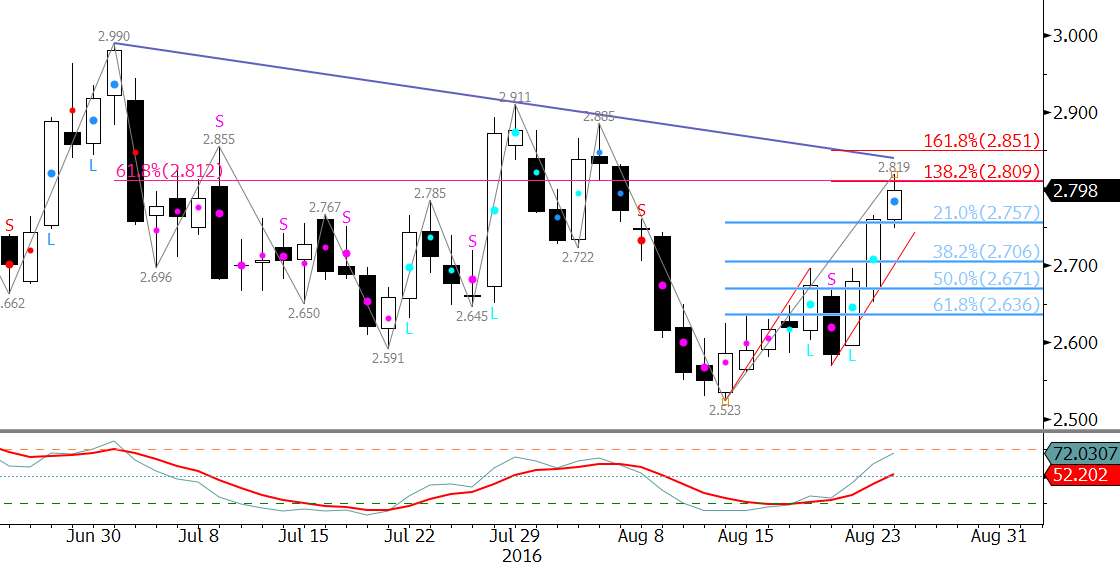
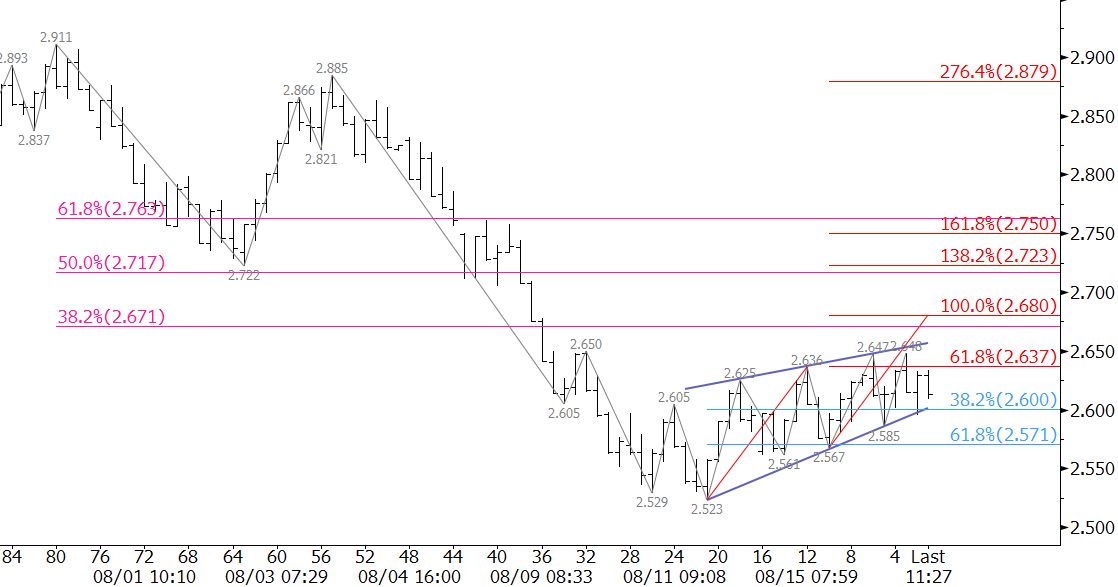
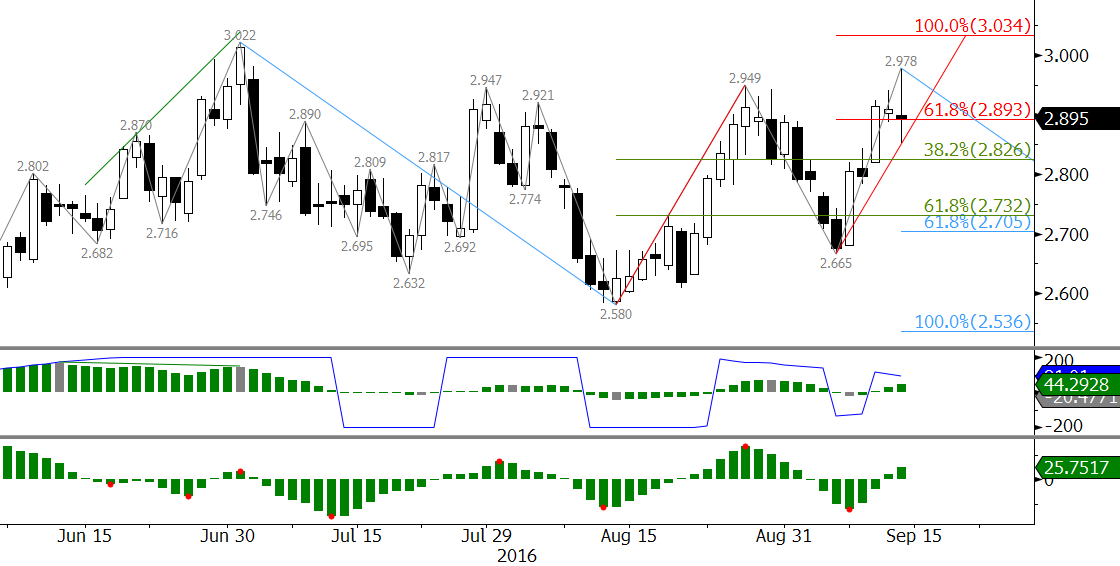
Early Wednesday, October natural gas rose above the very important $2.949 swing high and was poised to overcome the July 1 high of $3.022. However, October stalled at $2.978 and fell to $2.852. The reversal and blow-off high indicate the market is not ready for a break higher out of the corrective trading range.
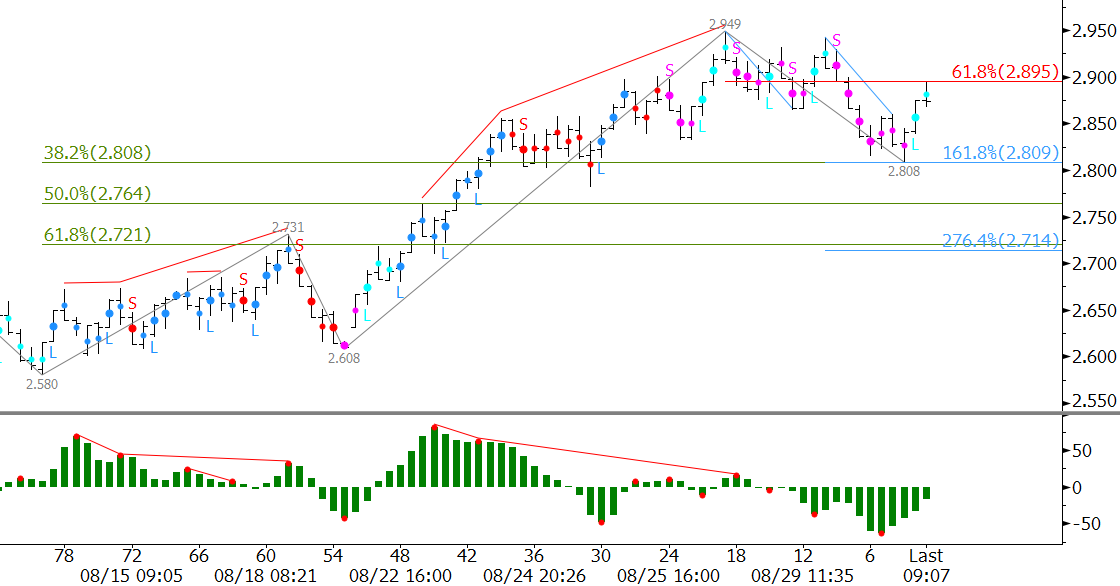
The recovery from $2.852 at the end of the day was somewhat positive. However, momentum is setup for bearish divergence on the daily chart. A bearish divergence forms when prices are rising to new swing highs but momentum is making lower highs. This signal shows that the move is nearing exhaustion and that a statically significant turn may take place. To confirm the divergence, a swing high in price and momentum must form over the next few days.
A close below $2.87 will complete Tuesday’s shooting star reversal pattern and open the way for $2.83 and $2.72.
If the move up is going to close over $2.95 and rise to the next target at $3.03 soon, $2.83 should hold. This is the 38 percent retracement of the move up from $2.58.
Key support is $2.72 because it is the 0.618 projection of the wave down from $3.022 and the 62 percent retracement of the move up from $2.58. A close below $2.72 would call for another test of the recent ranges lower threshold.
This is a brief natural gas forecast for the next day or so. Our weekly Natural Gas Commentary and intra-week updates provide a much more detailed and thorough analysis. If you are interested in learning more, please sign up for a complimentary four-week trial.