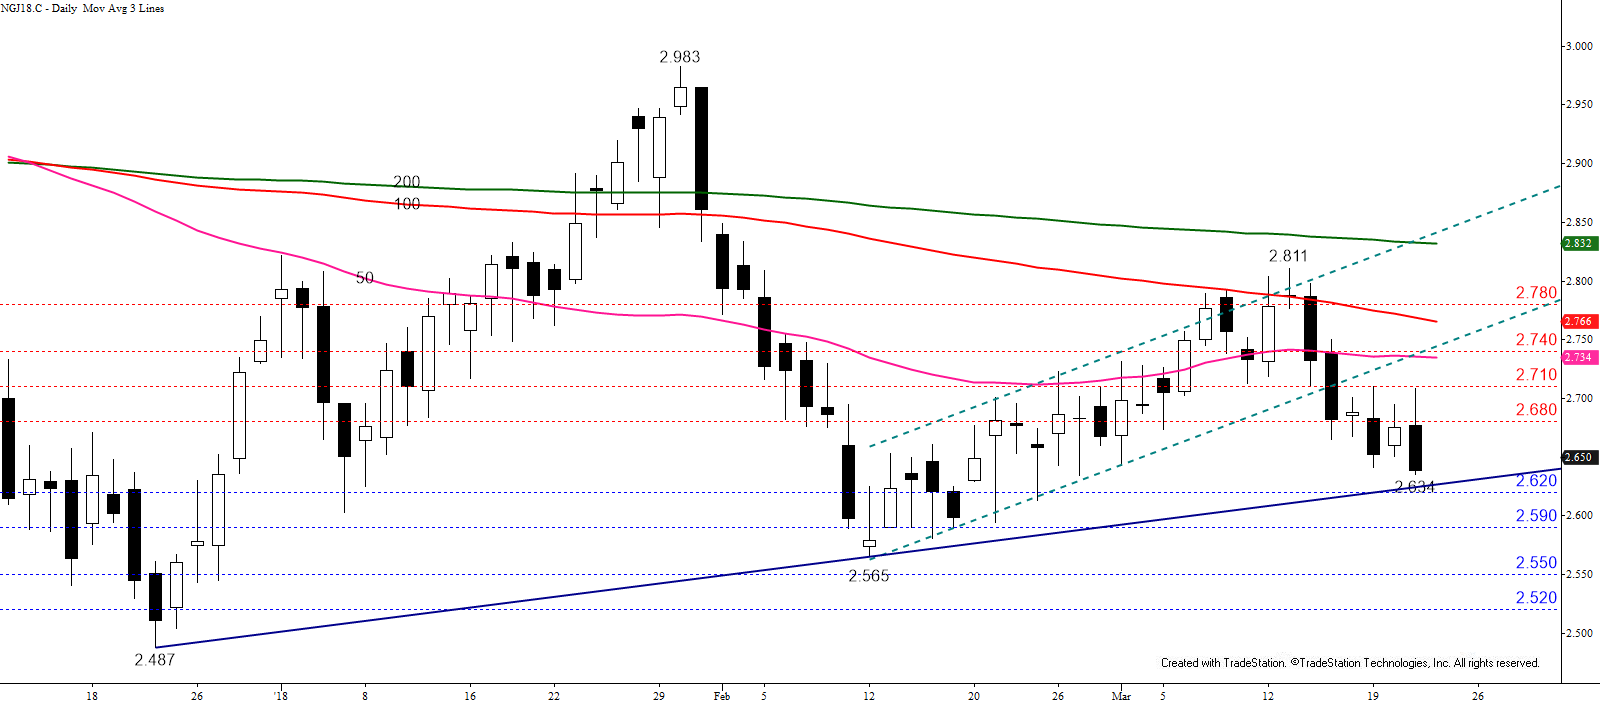
Natural gas continues to show signs that it has settled into a trading range between nominally $2.55 and $2.85. Trading will most likely remain erratic as the market awaits factors to push it out of the range. However, it may be awhile before such factors come forth as the market will be pressed to balance inventories that are well below the five-year average against strong production during the low demand spring shoulder months.
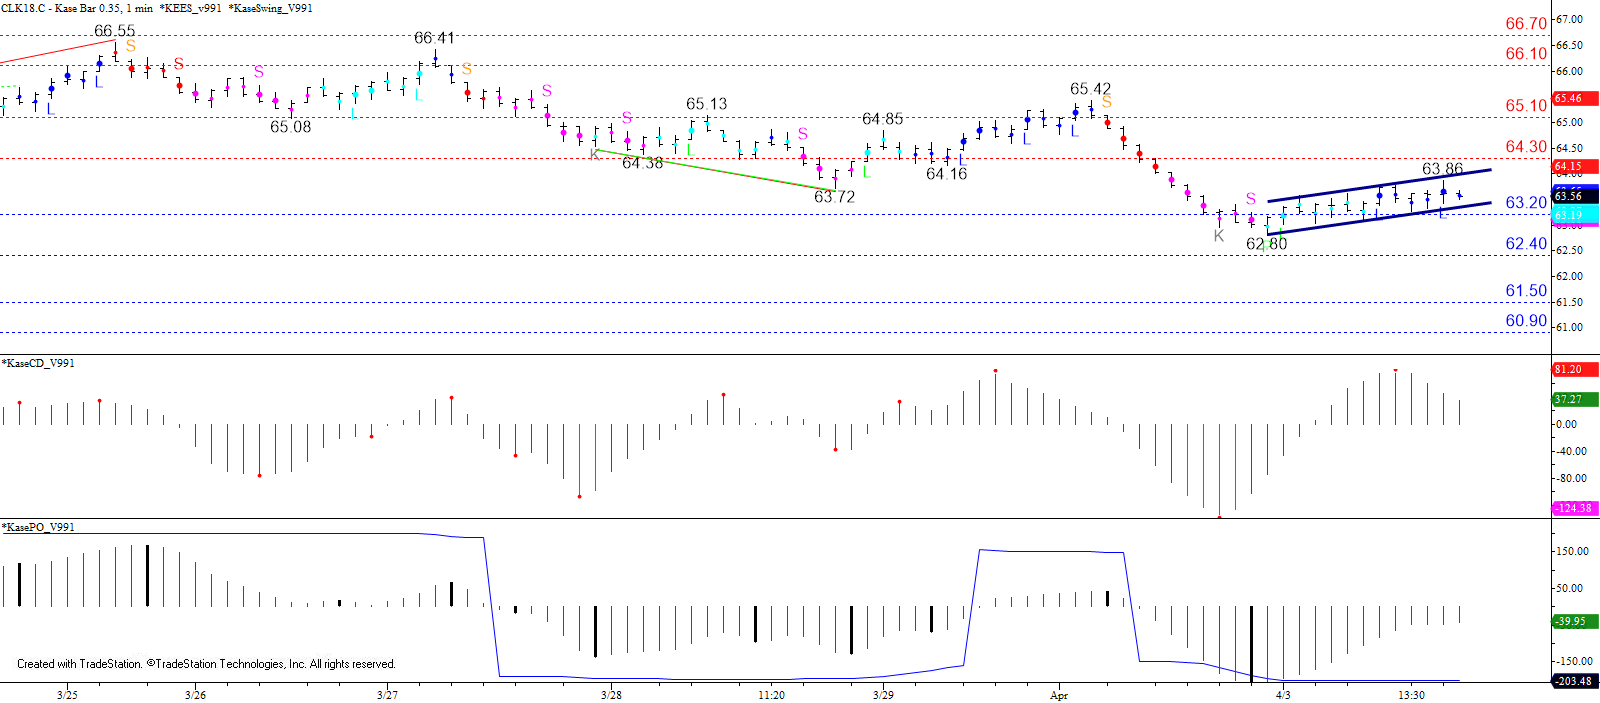
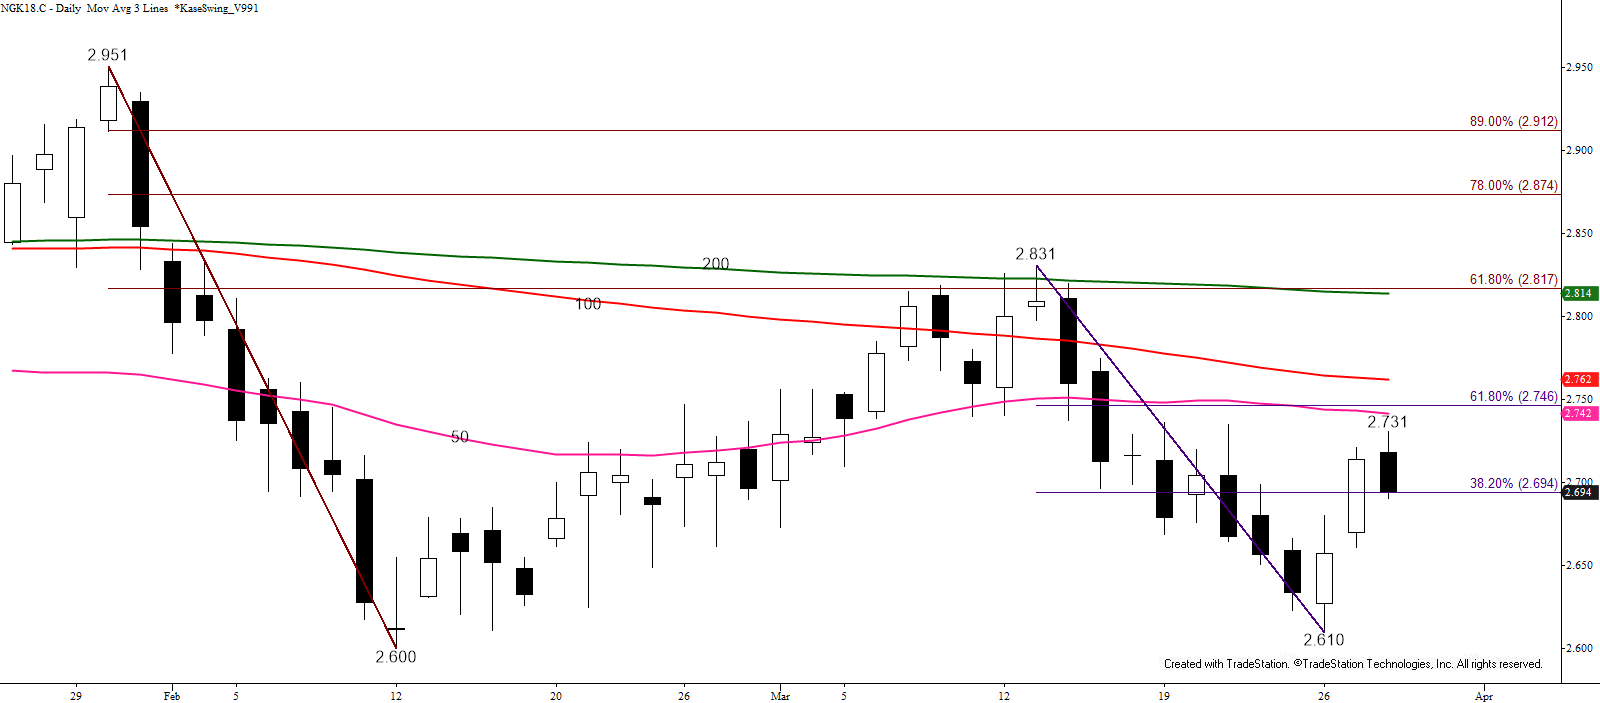
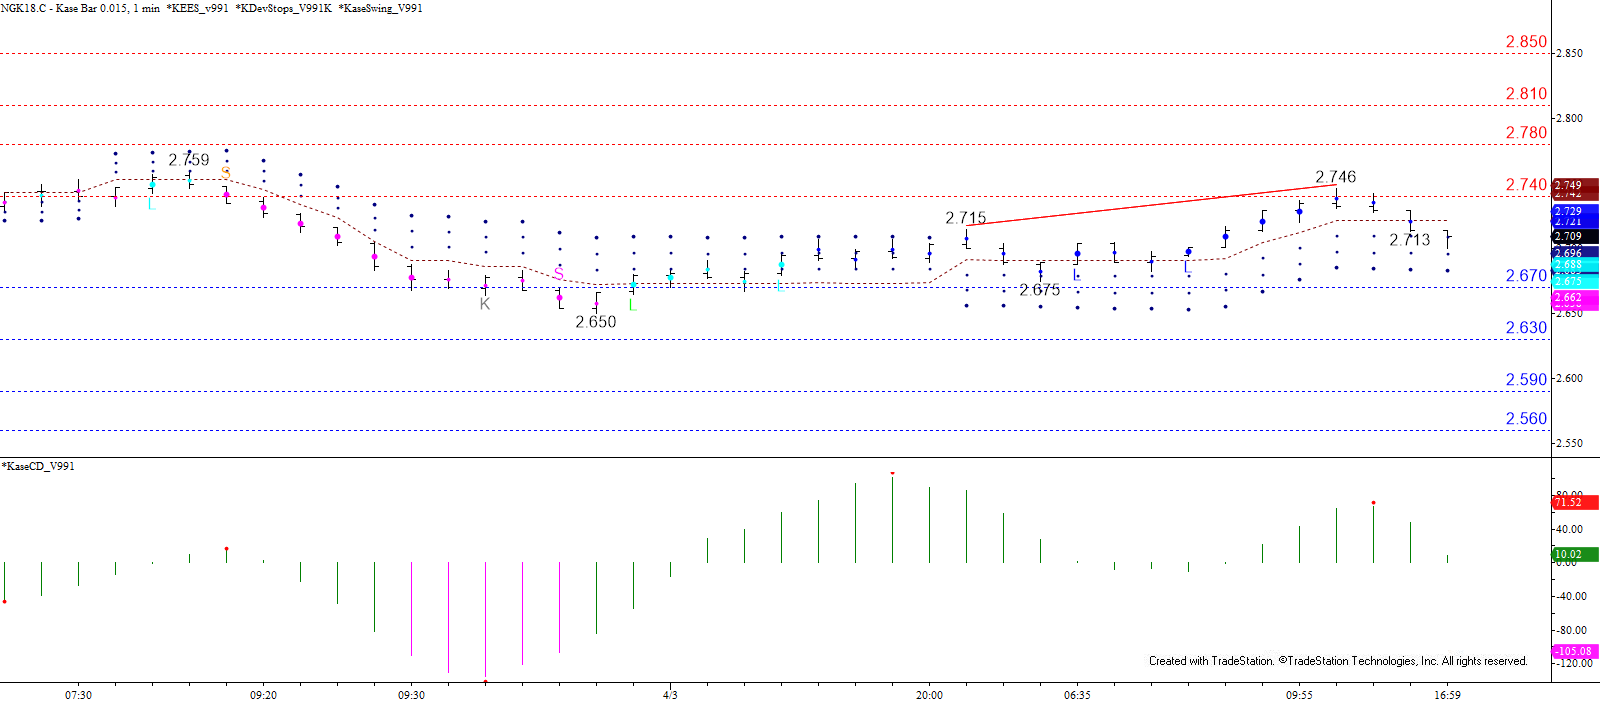
Quantitative factors are balanced and reflect the neutral near-term outlook. Today’s initial move lower held support at $2.67 before rising and challenging important resistance at $2.75. The subsequent pullback from $2.746 forms a long upper shadow on the daily candlestick and is poised to challenge $2.67 again tomorrow. The likelihood of a test of support was also accentuated by a confirmed bearish KaseCD divergence on the $0.015 Kase Bar chart. A close below $2.67 will call for $2.63, which connects to $2.59 and $2.56.
That said, trading will likely remain choppy and a close above $2.74 would open the way for $2.78. Settling above $2.78 would shift near-term odds in favor of challenging the top of the trading range around $2.85.
This is a brief analysis for the next day or so. Our weekly Natural Gas Commentary and daily updates are much more detailed and thorough energy price forecasts that cover key natural gas futures contracts, calendar spreads, the UNG ETF, and several electricity contracts. If you are interested in learning more, please sign up for a complimentary four-week trial.