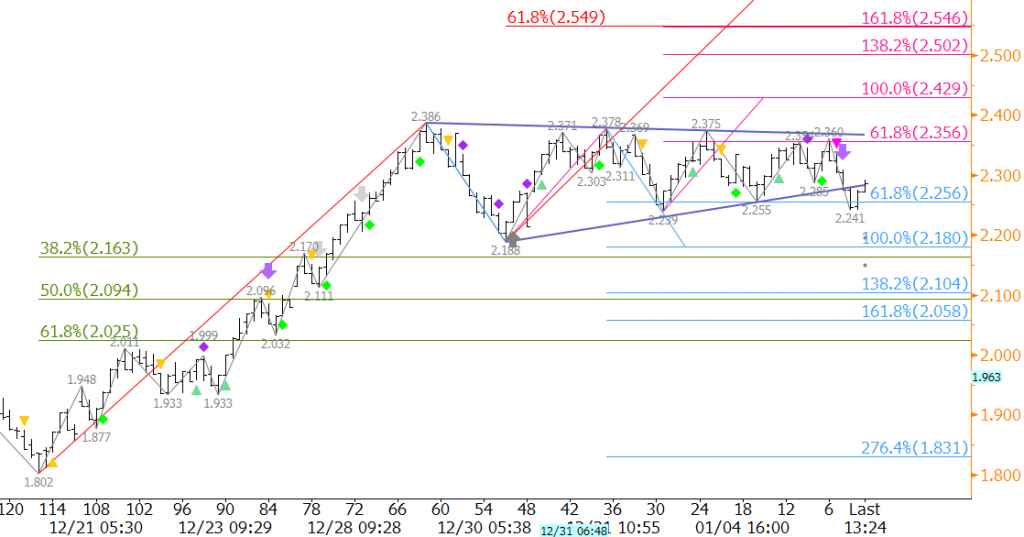
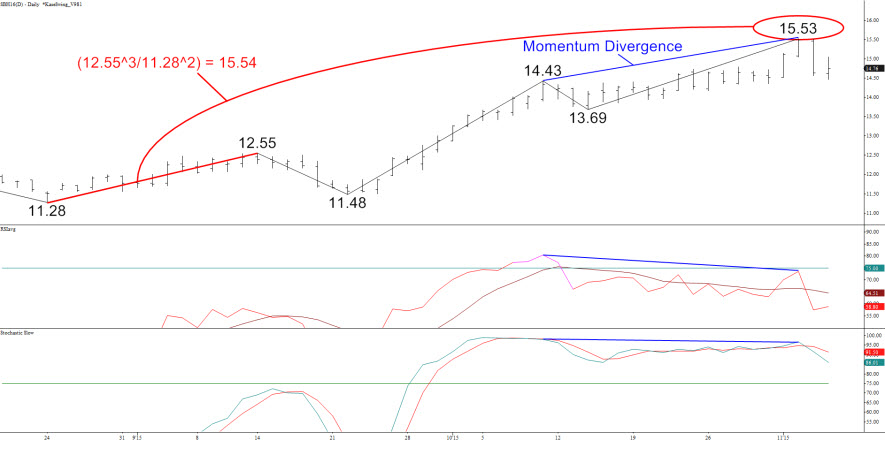
Kase Forecast of the Week – S&P 500 Index

S&P 500 Index (SPX)

By Dean Rogers

The slowing Chinese economy, lackluster manufacturing data, and a weaker yuan have sent Chinese stocks tumbling in the first week of 2016. China’s stock market has been halted twice this week when volatility limits were reached and is down seven percent over the last few days. The selloff has spilled over into global markets as the Dow Jones Industrial Average and S&P 500 Index are off to their worst starts for a year ever.

The S&P 500 Index (SPX) charts reflect the near-term negative tone. Several factors indicate the decline should challenge support levels below August’s 1867.01 low at 1842. This will be a crucial decision point for a much more bearish outlook and sustained decline over the next several weeks and possibly months.

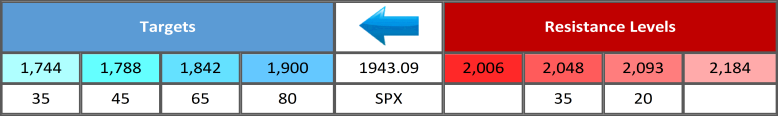
The table below shows SPX targets and resistance levels and the associated probabilities for meeting those targets and levels within the next 10 trading days. Kase’s technical forecasting models indicate odds are 80 percent for at least 1900 and 65 percent for 1842. The latter is the bearish decision point and will probably hold, at least initially.

SPX-Table

January 7’s close below the 62 percent retracement of the move up from 1867.01 to 2116.48 has shifted odds in favor of a continued decline. In addition, the 0.618 projection of the primary wave 2134.72 – 1867.01 – 2116.48 has been taken out by January 7’s close. Waves that close below the 0.618 projection generally extend to at least the 1.00 projection, in this case 1842 (+/- 7 points). Therefore, the SPX should fall to 1842 before a significant upward correction takes place. A close below 1842 would call for 1744 as the 1.382 projection for the wave down from 2134.72 with an intermediate confluence point at 1788.

SPX Daily with KaseXSPX-Daily

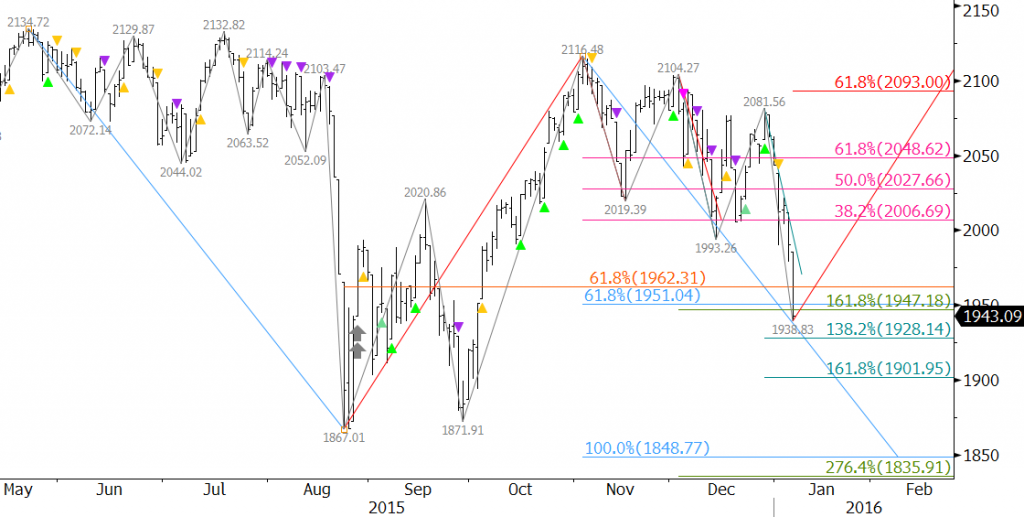
First resistance is 2006, the 38 percent retracement of the decline from 2116.48 to 1938.83. This level will most likely hold upon a correction. The key level for the near term is 2048, the 62 percent retracement. A close over 2048 would indicate the move down is most likely over and that the SPX will push towards at least 2093 which connects to 2184. A close over 2048 has 35 percent odds and a close over 2093 has 20 percent odds.

KaseX confirms the move down on the weekly chart. The recent overbought signal (gray arrow) and unfiltered short entries (pink triangles) indicate the decline should continue. On the daily chart, for those that are not already short, KaseX shows that it would be prudent to wait for a pullback and another confirmed sell signal (pink or purple triangle) after the recent short warning (yellow triangle).

SPX Weekly with KaseXSPX-Weekly

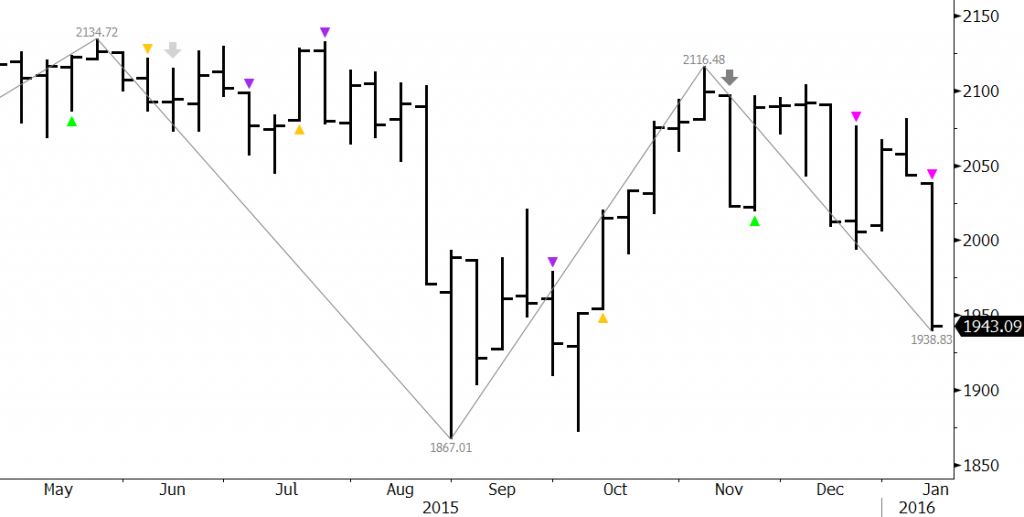
With all factors considered, the move down should continue and test the 1842 decision point in coming weeks. There is not enough technical evidence yet to definitively state that 1842 will hold. However, because of its importance, at a minimum, we expect at least a small upward correction to take place from 1842 once this target is met. Sustaining a close below 1842 would be extremely bearish for the long-term and could be the precursor to a bearish 2016.

This is a brief technical analysis of the S&P 500 Index based upon Kase’s technical forecasting models and trading indicator KaseX. If you are interested in taking a trial of KaseX please contact sales@kaseco.com. We would love to get your thoughts about the forecasted targets and probabilities. Leave a comment or send them along with your request for a trial to sales@kaseco.com.

By Dean Rogers

There is little doubt that the lack of demand for natural gas as a heating fuel this winter is taking its toll on prices. The market still looks and feels desperate to push higher, but fundamental and technical factors are working against this scenario. There is an outside chance prices could rally by another 10 to 15 cents on a close over $2.39, but we do not expect the move up to last much longer without a significant boost from external factors. In other words, it is going to have to get really cold, really soon, in key areas of the U.S., and last for several consecutive weeks for the move up to continue to any significant degree.

The move up from fresh 16 year lows stalled at $2.39 on December 29 and has subsequently oscillated in a narrowing range. A coil, or possibly an ascending triangle, has formed, and prices briefly broke lower out of the formation before Wednesday’s settlement. The formation indicates a breakout should take place very soon as the pattern nears its apex. The key levels to watch are $2.26 and $2.39.

NGG6 20160106

Odds favor a break lower due to KaseX’s bearish turn signal (purple arrow) on the 3.5-cent Kase Bar chart. A close below $2.26 would call for $2.17 and $2.09.

As stated, there is a modest chance that prices could rally 10-15 cents on a close over $2.39. However, even if this is the case, we do not expect prices to overcome $2.55 given current circumstances.

This is a brief natural gas forecast for the next day or so. Our weekly Natural Gas Commentary is a much more detailed and thorough analysis. If you are interested in learning more, please sign up for a complimentary four-week trial.

By Dean Rogers

Tension between Saudi Arabia and Iran have the oil markets on edge. The global supply glut still hangs heavy and will reportedly last through 2016. However, recent the geopolitical tensions could push prices higher on fear and greed alone.

The indecisiveness is being reflected on the charts. WTI’s recent move up from $35.35 has been choppy, and is most likely corrective. However, it did form an intraday bullish flag last week. We do not put much weight into the flag though because its $36.22 swing low is only $0.87 higher than the $35.35 contract low.

CLG6 20160104

WTI broke higher out of the flag early Monday, but failed to close above the upper trendline of the formation. This was negative, and the move down was preceded by a bearish KasePO divergence. Another test of support at $36.5 took place, but has held so far on a closing basis. $36.5 is the 62 percent retracement of the move up from $35.35 to $38.39. A KCDpeak (oversold) signal formed at $36.33.

The price action has now given us a clearly defined range between $36.5 and $38.0. Odds favor a close below $36.5. This would call for $35.7, which then connects to $34.91. Trading will remain choppy though, and external factors combined with the KCDpeak could still push prices higher. A close over $38.0 would call for the correction to extend to $39.2. For now, we do not see WTI rising much higher than $39.2.

This is a brief analysis and outlook for the next day or so. Our weekly Crude Oil Commentary is a much more detailed and thorough energy price forecast. If you are interested in learning more, please sign up for a complimentary four-week trial.

By Dean Rogers

Evolving weather models that had previously predicted a cold spell in the Northeast U.S. and in the Great Lakes region are reportedly now forecasting above normal temperatures in early January. This could dampen the likelihood of a further price rally for natural gas in coming weeks, and the charts tend to agree.

Today’s decline was quite negative for the near-term outlook, and $2.16 is an important target that should be tested in coming days. This is near the 0.618 projection of the wave down from $2.386 and the 38 percent retracement of the move up from $1.80. A close below $2.16 would call for $2.09 and $2.03.

NG G6 - eSignal

That said, this is a tough call right now because the market still seems desperate to rally after recently falling to 16 year lows. Wednesday’s decline could be a correction of the move up as prices attempt to extend toward a highly confluent $2.51 level. The late rally in trading after hours on Wednesday indicates $2.31 and even $2.37 might be tested in early trading ahead of Thursday’s EIA Natural Gas Storage report. We expect $2.37 will hold.

It is a bit early to call for a trading range, but we get the sense that is the most likely scenario for natural gas in coming weeks. The boundaries of the range could be quite wide, between approximately $2.03 and $2.37. Trading over the next few days should give us a better sense of what is in store for natural gas prices in early 2016.

This is a brief natural gas forecast for the next day or so. Our weekly Natural Gas Commentary is a much more detailed and thorough analysis. If you are interested in learning more, please sign up for a complimentary four-week trial.

By Dean Rogers

February WTI turned lower again on Monday and gave up just over 50 percent of its pre-holiday weekend gains that it had made on the move up from $35.35. The supply glut is still a concern and reports of Iran stating that exports are ‘priority’ after sanctions are lifted has put a dose of reality back into the long-term outlook for oil.

Technical factors reflect the negative near-term outlook. Monday’s close below $37.0 completed December 24’s evening star and indicates the decline should continue. WTI oil prices should now test the evening star’s $36.5 confirmation point. This is also the 62 percent retracement of the move up from $35.35 to $38.28. The $36.5 target is crucial, and it will be important for WTI oil prices to close below $36.5 within the next day or so to confirm that the move down is going to continue. A close below $36.5 is expected and would open the way for $36.1 and $35.2, both of which are confluent wave projections.

CL G6 - eSignal

The decline may be a grind lower and small corrections will likely take place, especially if gasoline prices start to rise again. Monday’s $37.4 midpoint should hold, but the key level for a renewed surge higher is $38.0. A close over $38.0 would call for at least $39.6.

This is a brief analysis and outlook for the next day or so. Our weekly Crude Oil Commentary is a much more detailed and thorough energy price forecast. If you are interested in learning more, please sign up for a complimentary four week trial.

By Dean Rogers

The darkest hour is just before the dawn. It is a phrase that most are familiar with that provides hope, even in the worst of circumstances. The outlook for WTI crude oil prices has been “dark” in recent weeks, and the longer-term outlook is still dim. However, December 14’s close over $36.13 provides a small shimmer of hope that a correction might finally be underway.

January WTI met a confluent and structurally crucial support target near $35.0 on December 14 and closed above December 11’s $36.13 midpoint to form a bullish piercing pattern. The piercing pattern is an early indication that a sustainable correction might finally be underway. A close over the pattern’s $36.63 confirmation point (December 11’s open) would call for at least $37.9, the 38 percent retracement from $43.46 to $34.53.

CLF6 20151214

The move up will most likely be corrective, but a substantial correction is long overdue. KaseX is not showing any signs of a turn yet, and the piercing pattern’s $36.63 confirmation point was tested and held. This dampens the likelihood of a reversal, but does not wipe out the potential completely. A close below $35.4 would negate the piercing pattern and call for the decline to continue towards the December 2008 perpetual swing low of $32.4.

Therefore, if the sun is going to rise $35.4 must hold and January WTI will need to close over $36.63 and then $37.9 within the next few days.

This is a brief analysis and outlook for the next day or so. Our weekly Crude Oil Commentary is a much more detailed and thorough energy price forecast. If you are interested in learning more, please sign up for a complimentary four week trial.

By Dean Rogers

Natural gas is still looking for support from weather, but until cold temperatures arrive in key areas of the U.S. prices should continue to grind lower. The negative bias is confirmed by KaseX’s filtered short signal (purple diamonds).

Natural Gas

January futures met an important target at $2.15 on Wednesday. This was the 0.618 projection for the wave $2.347 – 2.175 – 2.259. A close below $2.15 would call for key support at $2.10, the 1.00 projection.

The importance of $2.15 indicates a correction might take place first, but look for resistance at $2.22 to hold. A close over $2.22 would call for $2.26 and possibly $2.30. A move higher than $2.30 is doubtful without support from weather.

This is a brief natural gas forecast for the next day or so. Our weekly Natural Gas Commentary is a much more detailed and thorough analysis. If you are interested in learning more, please sign up for a complimentary four week trial.

By Dean Rogers

Natural gas’s upward correction has been held at bay as the market seeks frigid temperatures to support a move higher. January is settling into the familiar range between approximately $2.26 and $2.39 that December oscillated in before it finally broke lower. This is likely where prices will remain for the rest of the week due to the Thanksgiving holiday.

The move up is corrective, and that point was verified on Wednesday when prices initially broke higher out of an intraday coil and subsequently stalled at $2.347 before overcoming the $2.351 swing high.

NGF6 20151125

Meeting the 0.618 projection for the wave $2.229 – 2.351 – 2.258 indicates January could still test $2.39, which is near the 1.00 projection and the 38 percent retracement of the decline from $2.60 to $2.229, as long as the $2.258 swing low holds. However, without support from external factors (cold temperatures) the market will be hard pressed to rise above $2.39 and extend to the next confluence point of $2.48.

Odds favor the decline and a test of $2.26 by the end of this week. This is a tough call right now because the market is sitting on major support, and external factors could turn this market higher in a heartbeat. Therefore, provided $2.26 can hold, there is still a reasonable chance the upward correction will extend to $2.39, but at this point we would not hold our breath.

Happy Thanksgiving to all!

This is a brief natural gas forecast for the next day or so. Our weekly Natural Gas Commentary is a much more detailed and thorough analysis. If you are interested in learning more, please sign up for a complimentary four week trial.

By Dean Rogers

As we stated last week, the natural gas call is extremely tight right now. The market can only tell us what it knows about itself, and right now the market is not sure what it knows.

The move up from $2.188 stalled at $2.398 on November 6, and since then prices have worked their way lower in an extremely choppy manner to test major support at $2.25. This level held on today’s close, so technically prices are still trading within the range.

The market is waiting on cold weather to push it higher, but today’s price action did not help short-term bulls. It will eventually get cold and prices will rise, but today’s decline to $2.25 puts odds slightly in favor (around 60 percent) of a decline to test least $2.20 and possibly $2.12 over the next few days.

NGZ5 20151111

That said, $2.25 is an extremely important and highly confluent wave projection and retracement that has been tested a few times and has held on a closing basis since the move up from $2.188 began on October 30. Therefore, caution is warranted, and given the circumstances, we would not be at all surprised to see $2.25 continue to hold.

From a trading strategy standpoint, this is a time that we would normally recommend sitting on the sidelines for a bit while waiting for a more concise direction and break out of the $2.25 to $2.37 range. Upon a close below $2.25 or above $2.37, a trade may be taken upon a confirming long or short signal from indicators like Kase StatWare or KaseX. Shorter bar lengths are also recommended because they will help limit risk and should be used to pinpoint entries and exits and determine stop levels until there is a close either below $2.12 or above $2.48. At that point a clear long-term trend will have been established and trades may then be scaled to longer bar lengths with wider stops.

This is a brief natural gas forecast ahead of tomorrow’s EIA report. Our weekly Natural Gas Commentary is a much more detailed and thorough analysis. If you are interested in learning more, please sign up for a complimentary four week trial.

sugarBy Cynthia Kase

The market’s been watching the impact of El Niño since June. Then the National Oceanic and Atmospheric Administration said there was a 90 percent chance the baby would stick around all summer, and maybe even into 2016. Sugar has been rising since mid-August, as El Niño persisted, but turned choppy in October only to break to 15.53¢ as of the 3rd.

Apparently Niño’s wet weather is delaying the sugar harvest and fears have grown about undersupply. The technicals have been positive but slammed up against resistance at 15.53¢. So while it’s too soon to say if 15.53¢ is “it”, there is likely more downside.

15.53¢ is important for a few reasons. It failed by 5 points to reach the 21 percent retracement of the entire move down from 36.08¢ to 10.13¢ on the continuation chart. Second, the Stochastic and RSI momentum indicators were set up for bearish divergences at that price. Most important, 15.53¢ was a confluent target, as shown in the chart. That price is just 0.01 points shy of March’s “trend terminus” target (12.55^3/11.28^2) for the first wave up from 11.28¢.

SBH6_Fig1Charts created using TradeStation. ©TradeStation Technologies, Inc. 2001-2015. All rights reserved. No investment or trading advice, recommendation or opinions are being given or intended.

First support was met on Wednesday at 14.64¢. Next is 14.40¢, just 7 points below Thursday’s low. This is the 21 percent retracement for continuation’s entire move up, and a confluent retracement for the intermediate swings on both charts. It is also the 0.62 projection for the wave 15.53 – 14.47 – 15.05.

The key question is whether the decline, which only reached 15.47¢ versus 15.40¢ support, is over. The fact that the bounce up from 15.47¢ formed an ABC pattern where C is the 1.62 extension of A, exactly, and that prices then declined to 14.59¢, that is, below the prior 14.64¢ swing, means probably not.

14.40¢ remains to be broken, so a continued decline is not a sure thing, but 14¢, the major threshold, is likely.

The open and midpoints of candlesticks constitute support and resistance. Last week’s midpoint was 14.37¢ and the open for the week ending October 9, the last large up week prior, was 13.92¢. There’s also an important swing at 13.94¢. So as long as this holds (the lower end of a 14¢ +/- 0.1¢ range), odds are open for the bull market to resume.

Initial resistance is 15.40¢. The decline isn’t dead unless this is overcome. Above this, a highly confluent 15.95¢, the last remaining target (the Phi^3 corrective projection) for the first wave up, and occurs as a target 10 times for the 10 waves up from mid-October’s 13.69¢ swing low. The highest price to which the March chart projects which has a moderate probability is 18¢, the 0.62 projection of the entire move up.

Send questions to askkase@kaseco.com, and click the link learn more about Cynthia Kase’s latest video series, Kase on Technical Analysis.