Crude Oil Short-Term Forecast – February 13, 2018

Outlook for WTI

March WTI crude oil’s formation of a second daily star (in this case a hammer), confirmed daily KCDpeak, oversold Stochastic, and failure to break the $58.07 swing low are all factors that indicate the upward correction from $58.07 still has a reasonable chance of extending before the decline continues. However, unless WTI settles above at least $59.8 and more likely $60.4 to confirm the morning star setup (made up of the aforementioned stars) odds will continue to favor a decline.

March WTI Crude Oil
March WTI Crude Oil

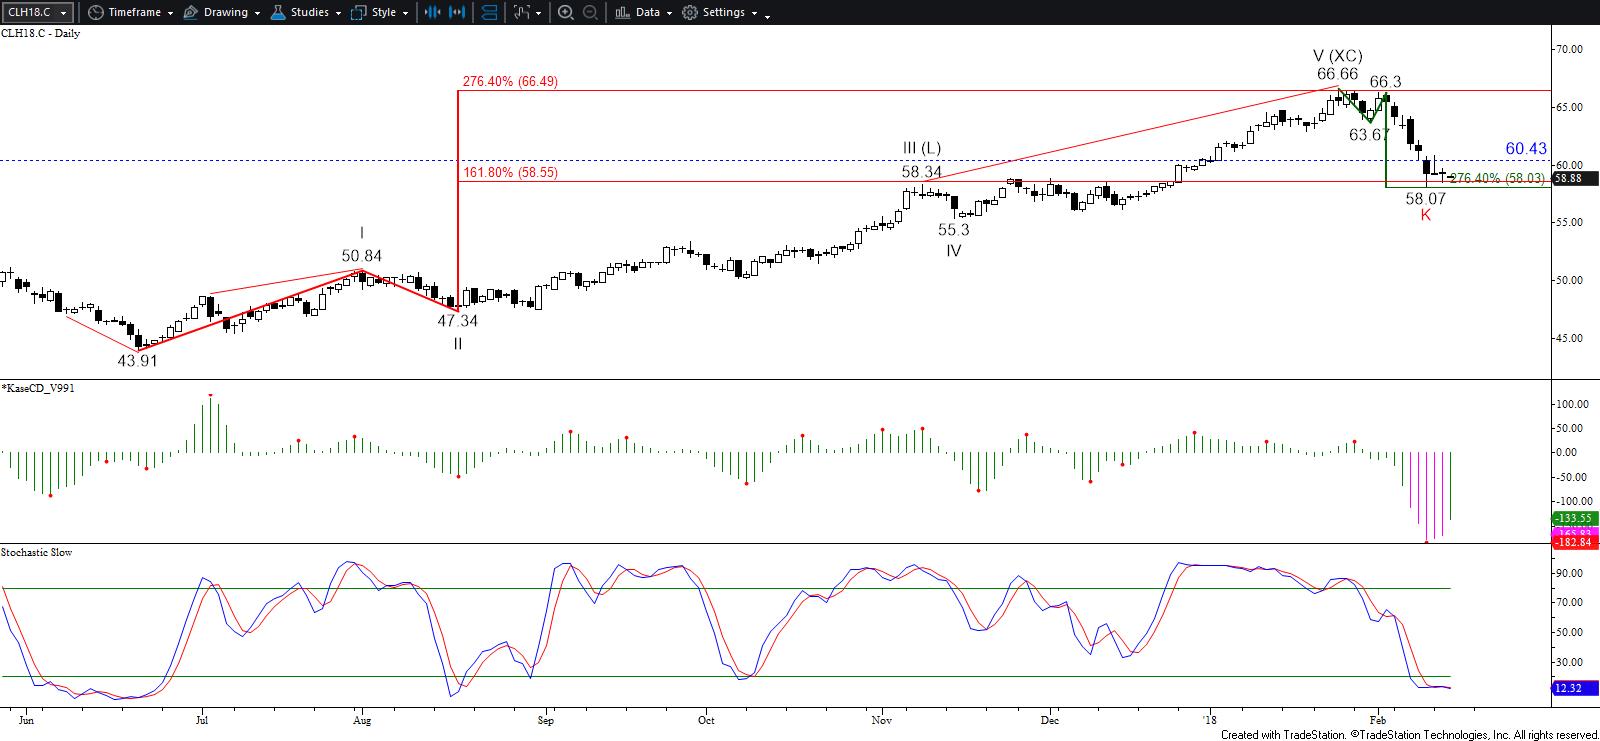
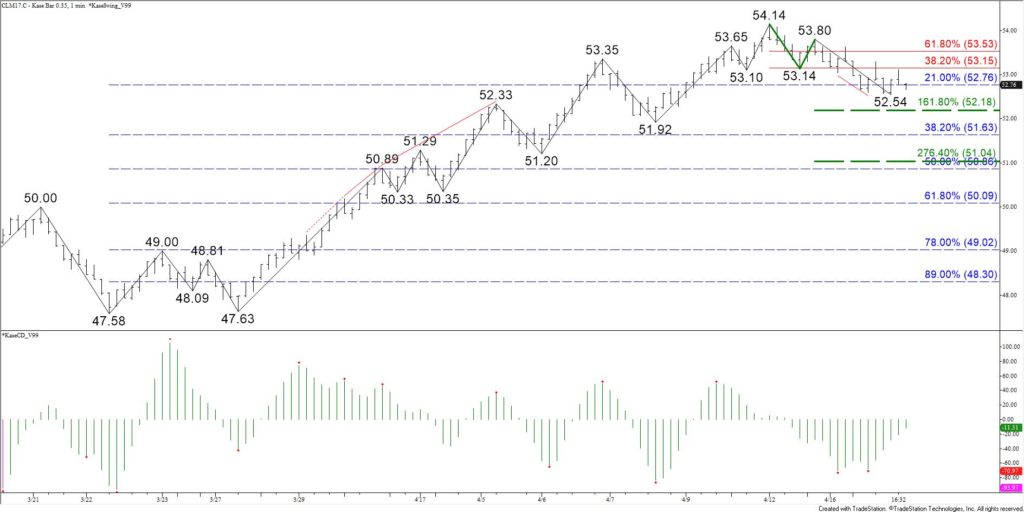
Initial support is the $58.39 swing low, and an early move below this tomorrow will call for $58.0, the smaller than (0.618) target of the wave $60.83 – 58.39 – 59.49. This is a key objective because it is the lowest that the initial wave down from $66.66 projection and is the 38 percent retracement of the move up from this past summer’s $43.91 swing low. Settling below $58.0 will open the way for $57.6 and very likely $57.1, the equal to (1.00) target of the wave down from $60.83.

Should the upward correction attempt to extend again tomorrow, look for initial resistance at last Friday’s $59.8 midpoint. This is the completion point of the morning star setup, a close above which would call for the $60.4 confirmation point. The $60.4 level is key for the near-term because it is also sitting just above the smaller than target of the wave up from $58.07. Settling above $60.4 would call for a likely move above the $60.83 swing high to $61.4, which is in-line with the equal to target of the wave up from $58.07 and the 38 percent retracement of the decline from $66.66.

This is a brief analysis for the next day or so. Our weekly Crude Oil Commentary and daily updates are much more detailed and thorough energy price forecasts that cover WTI, Brent, RBOB Gasoline, Diesel, and spreads. If you are interested in learning more, please sign up for a complimentary four-week trial.

WTI Crude Oil Forecast

March WTI crude oil confirmed bearish daily KasePO and KaseCD weak divergences. A weak divergence is one that forms when the confirming bar closes in the opposite direction of the signal, in this case, up. Weak divergences generally do not follow through as well as normal divergences but do warrant caution. In addition, yesterday’s midpoint held, leaving the daily dark cloud cover reversal pattern intact.

Tomorrow odds favor a continued decline to at least $63.2. This is the smaller than (0.618) target of the wave $64.83 – 63.25 – 64.14 and connects to $62.5 as the equal to (1.00) target. Settling below $62.5 would open the way for a larger pullback to $62.0 and even $61.6, the intermediate (1.382) and larger than (1.618) targets for the wave down from $64.83.

WTI Crude Oil Daily Chart

Should prices rise a bit higher first, look for $64.4 resistance to hold. A move above this would call for a new high of $65.1, a highly confluent and key threshold that connects to $66.3 and higher.

Natural Gas Forecast

February natural gas a crucial target at $3.29 when it rose to $3.288 today. This is an extremely important area for natural gas because $3.29 is in line with the equal to (1.00) projection of the wave $2.562 – 3.097 – 2.746, the 62 percent retracement of the decline from $3.772, and the 200-day moving average. A sustained close above $3.29 would confirm the market’s bullish sentiment, opening the way for a larger scale move up to $3.49 and possibly higher over the next few weeks.

That said, given the importance of $3.29 caution is warranted. This is a potential area in which the move up could stall and another sizable correction take place. In addition, the KaseCD, MACD, and Slow Stochastic are set up for bearish daily divergence.

Natural Gas Daily Chart

If prices are going to overcome $3.29 this week $3.18 should hold. Key support for the next few days is $3.13, today’s open and the 62 percent retracement of the move up from $3.039. A close below this would not doom the move up but would open the way for a more substantial correction to challenge support at $3.08 and even $3.01.

This is a brief analysis for the next day or so. Our weekly Crude Oil and Natural Gas Commentaries and daily updates are much more detailed and thorough energy price forecasts that cover key futures contracts, calendar spreads, and ETFs. If you are interested in learning more, please sign up for a complimentary four-week trial.

WTI crude oil continues to rise ahead of May 25’s OPEC meeting. Market participants are optimistic that OPEC will extend production cuts through the end of 2017. Many hope this will help to ease the global supply glut. U.S. production remains a concern, but for now, oil prices are poised to rise.

Most technical factors are positive. In recent days, July WTI sustained settles above the 62 percent retracement of the decline from $54.45 to $44.13. This is a strong indication that the recovery from $44.13 will continue.

July 2017 WTI Crude Oil - 35-Cent Kase Bar Chart
July 2017 WTI – 35-Cent Kase Bar Chart

Today’s break higher out of another intraday bullish flag and settle above Monday’s $51.43 high opens the way for $52.5. As shown in the chart above, this is a highly confluent wave projection that sits just above the 78 percent retracement of the decline from $54.45 to $44.13. The confluence of wave projections at $52.5 make it a potential stalling point.

Momentum on the KaseCD and KasePO is rising. The KasePO is setup for bearish momentum divergence, a reversal signal that forms when higher swing highs in price and lower swing highs in momentum are made. To confirm the divergence signal, a swing high in price and momentum must form before momentum rises to a new high.

The Kase Easy Entry System (KEES) also triggered a second class buy signal (light blue L) on the 35-cent Kase Bar chart today. A second-class buy signal indicates the majority of momentum indicators KEES examines are positive but that momentum on the synthetic longer bar length is negative. Traders using Kase StatWare may have taken a smaller position and placed a tighter trailing stop. Stops may be widened once the KEES permissions shift to first class (dark blue dots).

For the near-term, the $50.57 swing low is important support. A move below this would likely trigger the bearish KasePO divergence and open the way for a correction to $50.0 and possibly $49.6.

This is a brief analysis and outlook for the next day or so. Our weekly Crude Oil Commentary and daily updates are much more detailed and thorough energy price forecasts that cover WTI, Brent, RBOB Gasoline, Diesel, and spreads. If you are interested in learning more, please sign up for a complimentary four-week trial.

Last Wednesday, June WTI broke higher out of the intraday bullish flag discussed in the crude oil forecast. The subsequent move up overcame the 0.618 and 1.00 projections of the wave $43.76 – 46.98 – 45.53. However, June stalled at $49.66 before meeting key resistance at $50.1. This is the confluence point between the 1.382 projection and the 62 percent retracement of the decline from $54.14 to $43.76.

Ultimately, June WTI should challenge $50.1. A sustained close over this would be a strong indication the larger scale move down is over, for now. However, bearish KaseCD and MACD divergences on the $0.50 Kase Bar chart call for a test of support first.

June WTI Crude Oil - $0.50 Kase Bar Chart
June WTI Crude Oil – $0.50 Kase Bar Chart

So far, the decline from $49.66 has been reasonably shallow and choppy, indicating it is most likely corrective of the move up. Today, June settled below the 0.618 projection of the wave $49.66 – 48.73 – 49.38 and met the 1.00 projection at $48.5. Meeting the 1.00 projection means the correction may already be complete. However, until prices rise above the $49.38 swing high, odds favor a deeper correction to $48.1 and possibly $47.1.

If the move up is going to continue to $50.1 this week, $47.1 must hold. This is the 62 percent retracement of the move up from $45.53 to $49.66. A close below $47.1 would call for a deeper test of support and possibly for June to challenge the crucial $45.53 swing low.

This is a brief analysis and outlook for the next day or so. Our weekly Crude Oil Commentary and daily updates are much more detailed and thorough energy price forecasts that cover WTI, Brent, RBOB Gasoline, Diesel, and spreads. If you are interested in learning more, please sign up for a complimentary four-week trial.

The long-term outlook for WTI crude oil remains negative and it is too soon to state that a bottom has been made. However, last Friday, June WTI met major support at $43.76, the 1.00 projection of the wave $57.95 – 47.58 – 54.14 (exact projection was $43.77). This was also in the realm of the August 2016 swing low of $44.56 and the 62 percent retracement of the move up from $36.18 to $57.95 ($44.5). The confluence of support between $43.77 and $44.56 and the fact that this range has held on a closing basis favors a larger upward correction before the decline continues.

In addition to meeting support at $43.76, June WTI confirmed daily bullish divergences on the KaseCD and Stochastic and a bullish KasePO PeakOut (oversold signal). These signals call for the upward correction to extend. Most importantly, over the past two days, the pullback from $46.98 formed a bullish intraday flag, shown below on the $0.35 Kase Bar chart.

June 2017 WTI Crude Oil - $0.35 Kase Bar Chart
June 2017 WTI Crude Oil – $0.35 Kase Bar Chart

For now, according to Kase’s price forecasting model, odds are 65 percent for a break higher out of the flag. These odds will increase as prices rise toward the upper trendline of the flag at $46.6.

Important resistance at $47.6 should be challenged upon a break higher out of the flag. This is the confluence point between the 38 percent retracement of the decline from $54.14 to $43.76 and the 0.618 projection of the wave $43.76 – 46.98 – 45.53.

That said, there are some danger signs that indicate the flag, and other bullish technical factors, are on the teetering edge of failing.

The key to a break higher out of the flag and extended upward correction is holding support at $45.5. This is in line with the today’s $45.53 swing low and the flag’s lower trendline. A close below this would call for a test of $45.0, the 62 percent retracement of the move up from $43.76 to $46.98. Settling below $45.0 would shift near-term odds back in favor of testing the $43.76 low again.

This is a brief analysis and outlook for the next day or so. Our weekly Crude Oil Commentary and intra-week updates are much more detailed and thorough energy price forecasts that cover WTI, Brent, RBOB Gasoline, Diesel, and spreads. If you are interested in learning more, please sign up for a complimentary four-week trial.

On Tuesday, crude oil prices continued to slip lower. Technical factors indicate June WTI’s corrective decline from $54.14 is poised to extend to at least $52.2. This is the 1.618 projection of the wave $54.14 – 53.14 – 53.8 and the 50-day moving average. A close below $52.2 would call for key near-term support at $51.6. This target is crucial because it’s the 38 percent retracement of the move from $47.58 to $54.14 and the 200-day moving average.

June 2017 WTI Crude Oil - $0.35 Kase Bar Chart
June 2017 WTI Crude Oil – $0.35 Kase Bar Chart

That said, a bullish KaseCD divergence on the $0.35 Kase Bar chart indicates another test of $52.2 and possibly $53.6 might take place first. Resistance at $53.6 is expected to hold. A close over this would call for $54.3. However, a sustained close over $54.0 is the key to a continued rise. This is the 62 percent retracement of the decline from $57.95 to $47.58.

This is a brief analysis and outlook for the next day or so. Our weekly Crude Oil Commentary and intra-week updates are much more detailed and thorough energy price forecasts that cover WTI, Brent, RBOB Gasoline, Diesel, and spreads. If you are interested in learning more, please sign up for a complimentary four-week trial.

By Dean Rogers

As discussed last week, everyone is looking for the natural gas bottom. I am sure no one wants me to step back onto my “picking bottoms is a dangerous game” soap box, so I will just reiterate that the best anyone can do is identify potential turning points and look to time entries and exits that fit their trading style, risk appetite, and goals.

With that in mind, let’s discuss the potential turning points for natural gas at today’s $2.263 swing low and at $2.11, the latter of which I think is the most likely point for a bottom to be made.

December’s wave structure down from $3.391 has unfolded in a five-wave pattern. We are not Elliott Wave fanatics or strict practitioners, but when a textbook pattern forms we pay attention.

Below are some of the basic Elliott Wave rules we abide by and look for when a five-wave pattern forms.

Basic Elliot Wave Rules, according to Kase:

  • A five-wave pattern is made up of three impulse waves and two corrective waves
  • Two of the three impulse waves should be equal in size
  • The impulse waves, labeled I, III, and V, should break down into five sub-waves.
  • Wave III cannot be the smallest impulse wave
  • Waves I, III, and IV should be proportional to one another (0.618, 1.00, 1.382, 1.618, etc.)

For the five-wave pattern down from $3.391 wave I met its 1.618 projection at $2.607 (end of wave III) and trend terminus (2.9693/3.3912) at $2.263 (potential end of wave V). The lowest that wave I projects is $2.12 as the 2.764 extension.

NGZ5 20151028

Given the importance of $2.263, the ticks up after the close, and oversold conditions on the KasePO, KaseCD, and slow stochastic, prices might turn higher from this level.

However, at this point there are not two equal waves. At $2.36 waves I and V were equal, but prices fell to $2.263. At $2.10 waves III and V will be equal. Therefore, based upon the basic Elliott Wave Rules, December will likely fall to the confluence point of $2.11 where wave I will have met its 2.764 projection and waves III and V will be equal.

From $2.11 we would expect to see a three-wave correction, and because of the time of year, a significant rally as the market heads into the winter heating season. A sustainable rally will be confirmed by a KasePO PeakOut, KaseCD KCDpeak, and %K over %D crossover as momentum rises out of oversold territory on the slow stochastic.

There are no guarantees that $2.11 will hold over the course of the longer-term, but this has become the most likely point at which a bottom will be made.

This is a brief natural gas forecast ahead of tomorrow’s EIA report. Our weekly Natural Gas Commentary is a much more detailed and thorough analysis. If you are interested in learning more, please sign up for a complimentary four week trial.

targetBy Dean Rogers

It has been a wild week on Wall Street and for markets around the world. Global equities have ridden a roller coaster in the U.S., Asia, and Europe, the U.S. Dollar strengthened a bit after a tumultuous decline, and oil is trying to find its bottom after a significant rally to $42.86 from our weekly commentary’s $37.9 target.

U.S. 10 Year Treasury bonds have come along for the ride and have fallen to 127’18 so far after stalling at 129’28. The 129’28 high was just above our June 30, 2015 projected resistance of 129’16.5. At this point, as shown in the chart below, bearish momentum divergences formed when rising price highs were accompanied by falling momentum highs on the KaseCD, MACD, and slow stochastic.

TY daily

The divergences show that the decline will likely extend. However, there are several positive technical factors that indicate an upward correction should take place first.

The daily candlestick chart above shows a morning star setup that formed on August 27. The confirmation point (open of August 26) is 128’18. This resistance level is also in line with the 38 percent retracement of the decline form 129’28 as shown in the chart below. Should the decline extend as expected over the next few days, 128’18 must hold. A close over this would call for 128’31.5, the 62 percent retracement.

TY weekly

The wave formation down from 129’28, shown in green below, met the 0.618 projection at 127’18. Most waves (our studies show around 77 percent) that meet the 0.618 projection extend to at least the 1.00 projection, in this case 126’27. Therefore, odds favor at least 126’27. This is in line with the 62 percent retracement of the move up from 124’29 as shown in the daily chart (in blue). A close below 126’27 would call for 126’08 and 125’26.

In summary, for the near-term, these technical factors indicate U.S. 10 year treasuries should decline to at least 126’27, but that a small correction to 128’18 might take place first. The longer-term targets are discussed in our original article published June 30, 2015.

By Dean Rogers

Technical analysis provides traders and market analysts with extremely valuable tools that can help determine future support and resistance and major turning points. A good example of this came from our recent article Ask Kase: How to Trade the Shanghai Index that was published on June 9, 2015 by Cynthia A. Kase, CMT, MFTA. Ms. Kase’s analysis lead her to call for an overdue downward correction of the Shanghai Composite Index (SSE) once resistance at 5200 was met within a +/- 50 point tolerance. SSE rose to 5178.19 on June 12, before turning lower and eventually transitioning into the bearish collapse that has transpired over the past several weeks.

The market has blown through Ms. Kase’s lowest support level of 4550, below which she stated, “a much more sustained decline would commence”. She hit the nail on the head, and now, the techncials are showing us that SSE is poised for at least 2300 after a potential upward correction from 2947.94.

The decline from 5178.19 forms a very clear nested wave formation that has two primary waves: 5178.19 – 3373.54 – 4184.45 (blue) and 4184.45 – 3537.36 – 4006.34 (green). Both waves project to 2300 +/- 80 points. This is a very important target and potential bottom for SSE because it is the 1.00 projection for the wave down from 5178.19 (blue) and the 2.764 projection for the wave down from 4184.45 (green).

shanghai composite index waves

A sustained close below 2300 would call for a much more severe collapse to 2034, 1710, and possibly 1275.

As stated though, an upward correction might take place from 2947.94 before the decline continues. This is because both of the waves down from 5178.19 and 4184.45 met crucial projections around 3000. The 3000 level was also in line with the 62 percent retracement of the move up from the October 2008 swing low of 1664.93 to 5178.19.

To say the least, 3000 is important support, so a small correction to 3350, the 38 percent retracement of the decline form 4006.34 would be normal.

Retracements to 2947.94

shanghai composite index retracements

Key resistance for the near term is 3585, the 62 percent retracement from 4006.34 and the 50 percent retracement from 4184.45. A close over 3585 would open the way for 3755, the 62 percent retracement from 4184.45 and the 38 percent retracement from 5178.19. This is the level that must hold for the outlook to remain negative for at least the next few weeks.

A daily morning star setup (not shown) confirms that the upward correction might take place within the next few days. However, most momentum indicators show that a pullback will be nothing more than a temporary correction.

The weekly stochastic moved below 20 and is oversold, but it can remain there for weeks (or even months) before the index reverses significantly higher. All other momentum indicators, including the KaseCD and KasePO show declining momentum, which does not bode well for the formation of a bottom soon.

shanghai composite index weekly momentum

In summary, most technical factors are negative and odds favor a decline to at least 2300. A pullback from 2947.94 might take place first, but weekly and daily momentum indicators show that such a move will likely be corrective and should hold resistance at 3350 and no higher than 3585. Therefore, for now, buckle in for the rest of the ride lower.

Learn more about Kase’s trading indicators such as the KasePO and KaseCD, weekly crude oil and natural gas forecasts, and other services, at www.kaseco.com.

By Dean Rogers

For the past eight weeks September WTI crude oil futures have closed lower, and the decline is quickly approaching major support at $42.5. Many pundits claim the sky is falling, but it is usually at times like this that the market will finally find support and at least attempt to make a bottom.

We have discussed $42.5 as major target and potential bottom in our weekly blog update and in our detailed crude oil forecast for several weeks. There is no definitive evidence that the move down is going to end, but on Monday a few positive signs formed that indicate an extended upward correction may take place.

Monday’s bullish engulfing line, exhausted daily KasePO and KaseCD momentum, weekly divergence setups, and the intraday wave up from $43.35 all show that the upward correction may test $45.9 and possibly $47.5 before the decline continues.

wti crude oil

For now, there is no evidence that this will be a major correction, not yet at least, but the fact that the market is starting to show some positive signs of life could mean the move down will end soon.

That said, important resistance was met at $45.01, so we expect to see a pullback to $44.3, Monday’s midpoint, in early trading Tuesday. A close below $44.3 would negate many of the aforementioned positive factors and open the way for $42.5 to finally be met.

This is a brief analysis and outlook for the near-term. Our weekly Crude Oil Commentary is a much more detailed and thorough energy price forecast. If you are interested, please sign up for a complimentary four week trial.