Short-Term Natural Gas Forecast – January 23, 2018

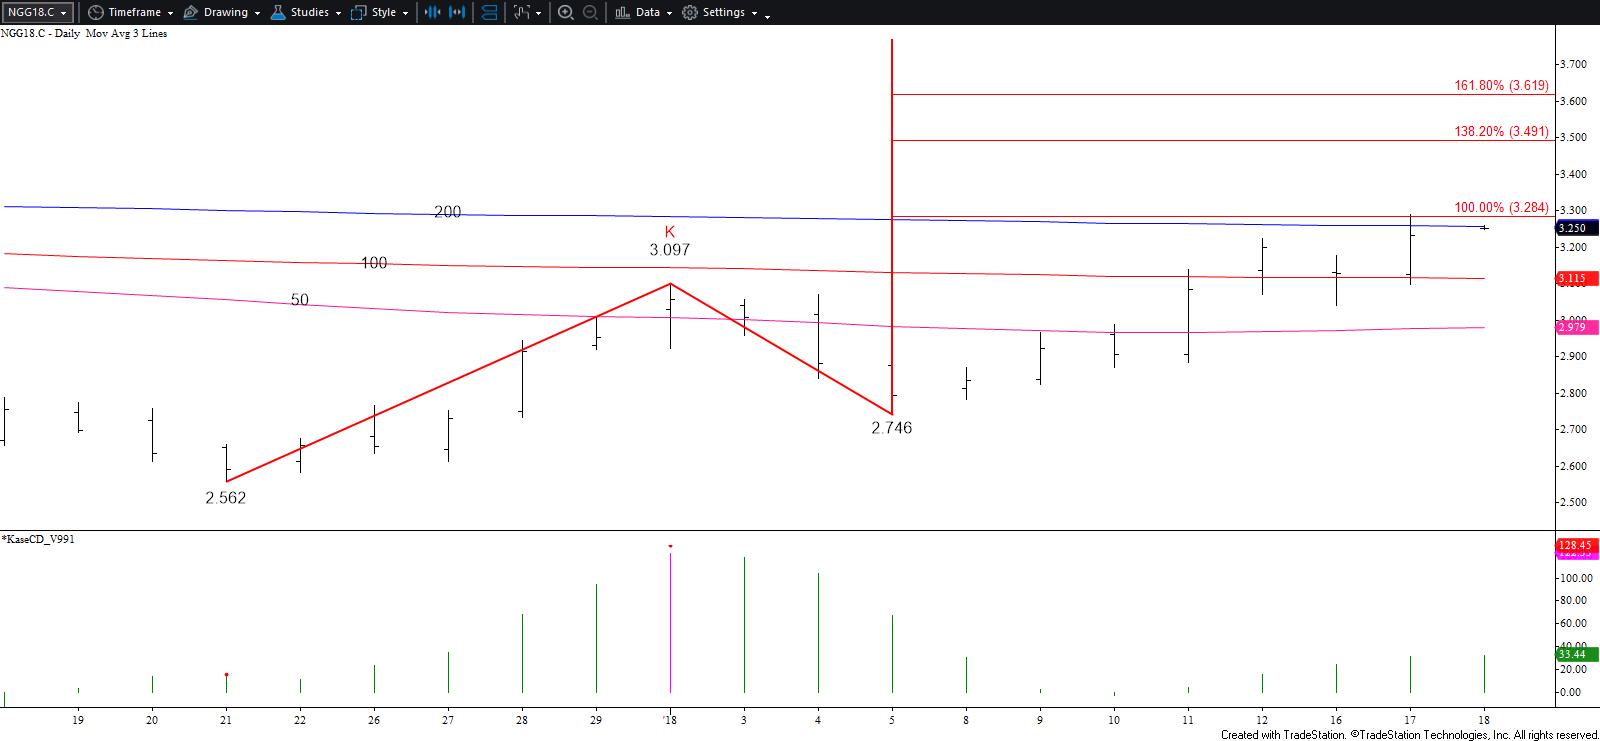
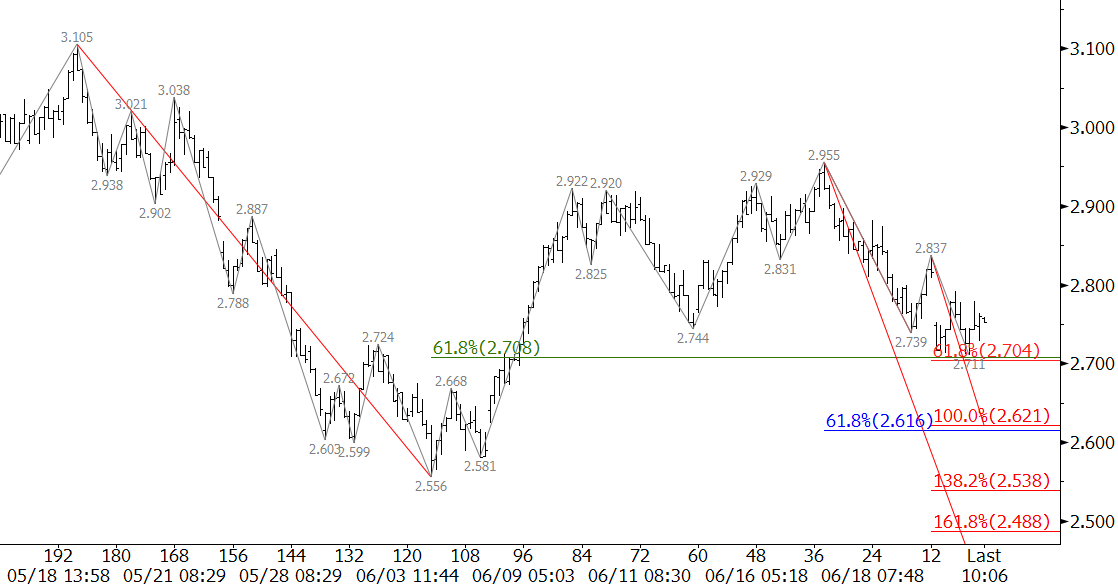
February natural gas finally broke through $3.32, the upper end of the confluence range around $3.29 +/- $0.03 discussed for the past few weeks. Although the day officially settled at $3.444, prices surged higher after the settlement to $3.628 and fulfilled the larger than (1.618) target of the wave $2.562 – 3.097 – 2.746 and the equal to (1.00) target of the wave $2.746 – 3.288 – 3.07. The confluence and importance of targets in this area make $3.628 a potential stalling point.

That said, it is difficult to call for the move up to stall after such a strong rally. Odds favor a continued rise and a move above $3.59 in early trading will open the way for $3.65 and higher.

Natural Gas $0.035 Kase Bars

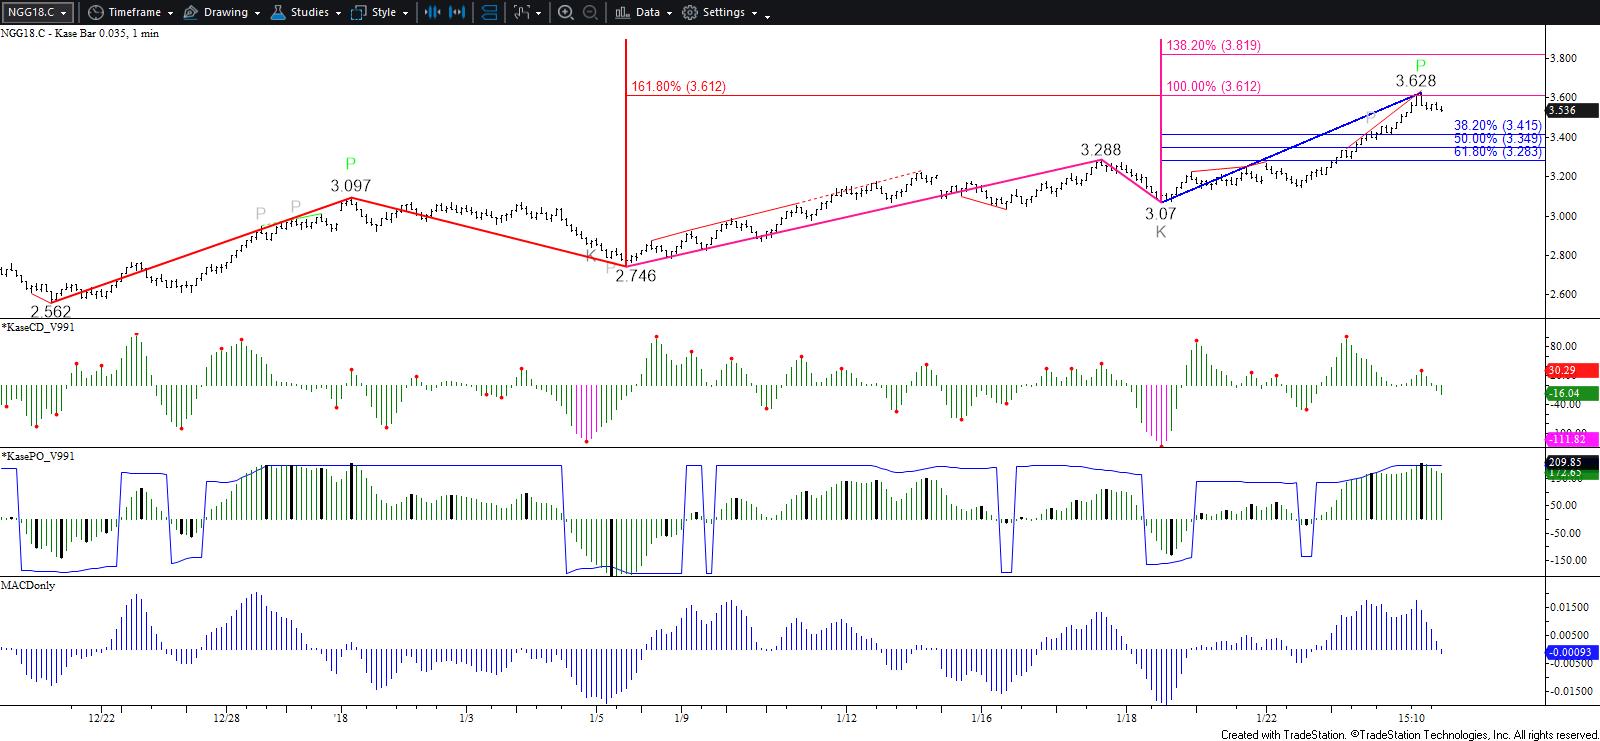
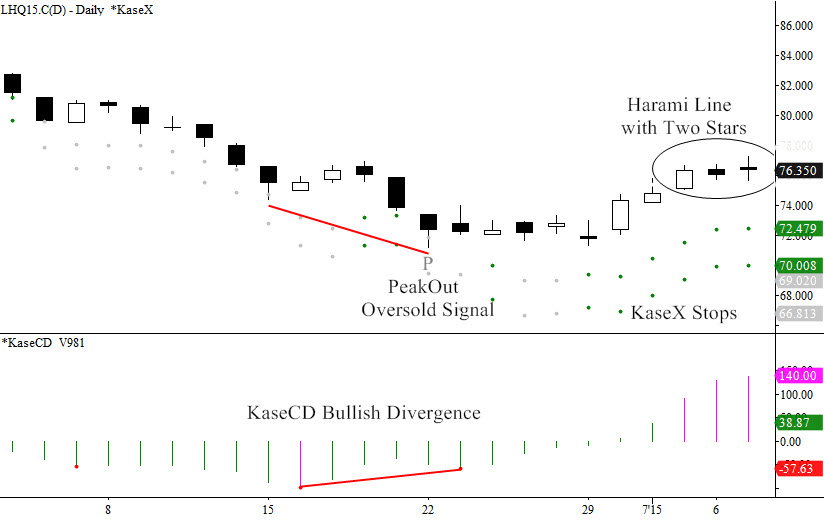
Even so, bearish intra-day divergences, a PeakOut (overbought signal), and the small wave down from $3.628 indicate a pullback to $3.48 and possibly $3.42 will probably take place first. Support at $3.42 should hold. Key support is $3.35, today’s open-close midpoint and the 50 percent retracement of the move up from $3.07. A close below this would confirm the move up has stalled, at least temporarily, and call for a test of $3.25, today’s open and the 200-day moving average.

The bottom line is that trading may become extremely volatile over the next few days and even weeks as the market sorts through the extent of the effects of external factors (i.e. developing polar vortex in February). If the market’s outlook is going to remain bullish through the end of winter, it will have to hold support above at least $3.25 and likely $3.35.

This is a brief analysis for the next day or so. Our weekly Natural Gas Commentary and daily updates are much more detailed and thorough energy price forecasts that cover key natural gas futures contracts, calendar spreads, the UNG ETF, and several electricity contracts. If you are interested in learning more, please sign up for a complimentary four-week trial.

WTI Crude Oil Forecast

March WTI crude oil confirmed bearish daily KasePO and KaseCD weak divergences. A weak divergence is one that forms when the confirming bar closes in the opposite direction of the signal, in this case, up. Weak divergences generally do not follow through as well as normal divergences but do warrant caution. In addition, yesterday’s midpoint held, leaving the daily dark cloud cover reversal pattern intact.

Tomorrow odds favor a continued decline to at least $63.2. This is the smaller than (0.618) target of the wave $64.83 – 63.25 – 64.14 and connects to $62.5 as the equal to (1.00) target. Settling below $62.5 would open the way for a larger pullback to $62.0 and even $61.6, the intermediate (1.382) and larger than (1.618) targets for the wave down from $64.83.

WTI Crude Oil Daily Chart

Should prices rise a bit higher first, look for $64.4 resistance to hold. A move above this would call for a new high of $65.1, a highly confluent and key threshold that connects to $66.3 and higher.

Natural Gas Forecast

February natural gas a crucial target at $3.29 when it rose to $3.288 today. This is an extremely important area for natural gas because $3.29 is in line with the equal to (1.00) projection of the wave $2.562 – 3.097 – 2.746, the 62 percent retracement of the decline from $3.772, and the 200-day moving average. A sustained close above $3.29 would confirm the market’s bullish sentiment, opening the way for a larger scale move up to $3.49 and possibly higher over the next few weeks.

That said, given the importance of $3.29 caution is warranted. This is a potential area in which the move up could stall and another sizable correction take place. In addition, the KaseCD, MACD, and Slow Stochastic are set up for bearish daily divergence.

Natural Gas Daily Chart

If prices are going to overcome $3.29 this week $3.18 should hold. Key support for the next few days is $3.13, today’s open and the 62 percent retracement of the move up from $3.039. A close below this would not doom the move up but would open the way for a more substantial correction to challenge support at $3.08 and even $3.01.

This is a brief analysis for the next day or so. Our weekly Crude Oil and Natural Gas Commentaries and daily updates are much more detailed and thorough energy price forecasts that cover key futures contracts, calendar spreads, and ETFs. If you are interested in learning more, please sign up for a complimentary four-week trial.

November WTI crude oil met the 62 percent retracement of November’s decline from the 2017 $58.37 swing high to $42.8 at $52.42 when it rose to $52.43 early this morning. This is major resistance because it is also a confluent wave projection. Settling above $52.6, the upper end of the confluence range around $52.42, would be bullish for the long-term.

Crude Oil Daily Candlesticks

For now, the long-term outlook remains positive. However, normally, when such an important target is met a significant correction will take place before that objective is overcome on a sustained closing basis. Today’s pullback from $52.42 formed a bearish Harami line and star, which is a reversal pattern. These patterns are not highly reliable, but the overbought daily Stochastic, RSI and nearly overbought KasePO indicate a pullback should take place soon.

This afternoon’s move up after the API Petroleum Inventories report was released indicates $52.6 might be tested early tomorrow. However, we expect this level to hold and for the downward correction to extend to at least $51.4 tomorrow, which is in line with Monday’s $51.45 midpoint. A close below this would open the way for $51.0 and possibly lower.

At this point, even a normal correction of the move up from the $46.14 swing low could drop prices to $50.0 should the corrective pullback extend as expected.

This is a brief analysis for the next day or so. Our weekly Crude Oil Commentary and daily updates are much more detailed and thorough energy price forecasts that cover WTI, Brent, RBOB Gasoline, Diesel, and spreads. If you are interested in learning more, please sign up for a complimentary four-week trial.

By Dean Rogers

January WTI futures met crucial support at $40.41 early Monday. This was the 1.00 projection for the wave $52.02 – 43.52 – 49.23. The subsequent move up was initially promising for bulls, but stalled at $42.75 before it could overcome $43.2 resistance.

CLF6 20151123-DIt is a tight call tomorrow, but we expect a test of $40.9 before the move up continues. This is confirmed on the intraday charts by the latest KaseX weak short signal (pink triangle). Support at $40.9 is near the 0.618 projection of the wave $42.75 – 41.09 – 42.62 and the $41.09 swing low. A close below $40.9 would call for $40.0 and possibly lower.

CLF6 20151123

Conversely, not all hope is lost for the upward correction to extend. The daily chart’s Kase Easy Entry System (KEES) permissions shifted from first class short (pink dots) to second class long (light blue dot). Therefore, there is still a reasonable chance for a close over $43.2 and an upward correction to $43.8, the 38 percent retracement from $49.23 to $40.41. A close over $43.8 would significantly increase the probability for an extended move to test major resistance levels.

This is a brief analysis and outlook for the next day or so. Our weekly Crude Oil forecast is a much more detailed and thorough energy price forecast. If you are interested, please sign up for a complimentary four week trial.

hogsby Cynthia A. Kase

Read on TraderPlanet.com

After last year’s viral outbreak that killed millions of hogs, pork production, now having recovered, looks to set records and overshoot demand. Apparently some commodity advisors are panicking and recommending that their producer clients use lean hog futures to hedge and avoid even lower prices. Is this a good idea?

To our view, hedging hogs today would be like closing the sty door after the pig has fled. In Kase’s energy practice, producers hedge when markets are enjoying high prices, not when already painfully low. At this point, defensive measures are called for.

The reason I’d be a reluctant outright seller or short hedger is that prices have been rising over the past few weeks, not falling. Looking at the August 2015 contract, prices fell from a 95.35 high last November to a 71.175 low June 22. Then the KasePO and KaseCD momentum indicators generated bullish oversold and momentum divergence signals. A 71.275 swing low followed, forming a classic “W” shape, or double bottom.

lean hogs

Last week’s candlestick completed a classic bullish morning star. However, the pattern remains unconfirmed until a close over 76.65, dampening the bullish tone. Also, the daily chart shows a potentially negative Harami line with two stars.

While the overall structure is down, the current 6 cent bounce could continue to 79 and maybe 81.5. A close over 81.5 hasn’t high odds right now, but if it happens we could see another 10 cents. 79 is the 2*1.38 extension and Phi2 corrective projection for 71.175 – 74.05 – 71.275. For the final wave up spanning from July 2 to July 7, 75.175 – 77.275 – 75.625, 79 is the 1.62 extension and 81.5 is both the trend terminus (77.2753/75.1752), and 2*1.38 extension.

If there isn’t a close over 76.65 soon, the rally might fail. A close below June 2s open, 75.15, followed by 72.4 would be cause for concern. A close below 70 could send lean hog prices squealing – potentially to 55 cents as, from a technical standpoint, targets ranging from 67 down to 55 have similar odds.

72.4 and 70 are KaseX stops. The key wave, 95.35 – 86.00 – 90.65, targets 70 as the important 1.62 extension. The last down wave, 77.275 – 75.625 – 76.625 targets 72.4 as the trend terminus (77.2753/75.6252), 2*1.38 extension and Phi3 corrective projection.

Here’s my hedging strategy. If you’re ok with “getting called”, sell calls above the market, maybe just above 81.5, perhaps purchasing puts on the downside with the funds depending on your risk appetite and whether you need to qualify for hedge accounting. Otherwise wait for a drop below 75.15 or so, then scale-in short calls maybe five cents or so above the market, again possibly buying puts. Meanwhile, grab a beer and a brat and watch the thresholds.

Send questions for next week to askkase@kaseco.com, and for energy hedging visit the Kase Energy Hedging Services page.

Charts created using TradeStation. ©TradeStation Technologies, Inc. 2001-2015. All rights reserved. No investment or trading advice, recommendation or opinions are being given or intended.

Day-to-day speculation regarding summer weather forecasts continue to dominate short-term natural gas prices. The lack of clarity has caused natural gas to settle into a range between $2.55 and $2.95 after failing to close over the upper end of the range last week.

Technical factors show that prices are due for a test of the lower end of the range where contract lows will be challenged. Because the wave down from $2.955 (shown in red) met its 0.618 projection we expect to see at least its 1.00 projection of $2.62. This is also the 0.618 for the wave down from $3.105 (shown in blue).

natural gas prices

That said, it is still early for support to give way to the longer-term bearish trend, so the decline will likely be a grind. Support at $2.71 is holding strong, but a disappointing EIA storage report tomorrow would clear the way for $2.62. This is a confluence point just like $2.71, so $2.62 should hold.

Key resistance is $2.83 because it is in line with the $2.837 swing high. Overcoming $2.837 will take out the wave down from $2.955 and negate the near-term potential for $2.62.

This is a brief natural gas forecast ahead of tomorrow’s EIA report. Our weekly Natural Gas Commentary is a much more detailed and thorough analysis. If you are interested, please sign up for a complimentary four week trial.

The crude oil market as a whole has continued to be dominated by stale and conflicting fundamental, technical, and geopolitical factors. These factors have brought about as much balance to the crude oil markets as Anakin Skywalker brought to the force. The most interesting factor is that many market participants seem to forget that markets have three direction: up, down, and sideways. Right now, WTI is stuck in a mind numbing sideways range. I say this because it is almost as exciting as watching the grass in my backyard grow.

During times like this we tend to grow impatient and frustrated. The easiest way to deal with a range bound market is to walk away, take a few deep breaths, work on our short game, and come back to play another day. However, we don’t all have that luxury, and have no choice but to participate and be driven insane by the constant change of direction and endless supply of chalky antacids we are popping like candy.

Luckily, technical analysis can help us to clarify the crucial breakout points for this range. Our models, which are based upon a combination of many different technical factors, show crucial resistance at $62.0 and support at $57.5. In addition, the line on close chart shown below confirms that these are the clear boundaries of the trading range. A break out of this range will help determine the direction for the next few months.

crude oil

The challenge is that it is nearly a toss-up as to which direction the market will break.

Our weekly Crude Oil Commentary goes into great detail about the implications of a break higher or lower out of this range. We break down the wave formations, retracements, candlesticks, momentum, and other factors. The bottom line is that the range may be corrective, which means prices should break higher. However, our models show that that $57.5 will be tested at least once more before WTI closes over $62.0.

This is a brief analysis and outlook for the next day or so. Our weekly Crude Oil Commentary is a much more detailed and thorough WTI and Brent crude oil price forecast. If you are interested, please sign up for a complimentary four week trial.

For the past few weeks WTI crude oil prices have risen significantly, and for the first time since early December 2014 prices closed above $60.0 last week. However, many traders are questioning the long-term validity of the price rise continuing due to concerns of a persistent supply glut, and the technical factors show that the market reached a crucial decision point at $62.58 last week.

The June WTI futures contract met crucial resistance at $62.58 on Wednesday, May 6, and as called for in our weekly Kase Crude Oil Commentary, prices have begun to pullback in a corrective manner. The correction is taking place after a blow-off high and evening star setup formed that same day. The evening star (some might say shooting star) was both completed and confirmed on Thursday when prices closed below the midpoint and open of Tuesday’s Harami bar. In addition, bearish divergences on the KaseCD and KasePO were confirmed on Friday. The combination of negative short term technical factors indicates the downward correction should extend and will likely form Wave IV of a longer-term five wave formation that projects to target in the mid-to upper $60s and even the low $70s.

WTI Crude Oil

We expect the pullback to challenge at least $56.2. This is the 38 percent retracement of the move up from $45.93 and is near the bottom of the sub-wave 4 of III. If prices are going to extend to new highs in the next week or so, $56.2 must hold. Otherwise, a close below $56.2 would call for the 50 and 62 percent retracements at $54.3 and $52.3. For now, it looks as though $56.2 will hold. The long-term outlook would only shift back to being bearish upon a close below $52.3. We do not expect to see a decline of that magnitude.

Today’s decline was nominal, so the next few days will be crucial for the near-term direction. A close over last Thursday’s $59.82 midpoint would shift the near-term outlook back to positive, call for another test of $62.5, and likely open the way for the five-wave pattern to unfold to upper targets of $66.8 and $71.5 over the course of the next few months.

Take a trial of Kase’s weekly crude oil forecasts to receive more in-depth analysis every week.

Brent crude’s failure to close above the $57.5 completion point of the weekly morning star setup (circled in green) was negative and indicates the geopolitically driven move up that took place last week may be short lived. The Brent crude price rose modestly on Monday, but most short-term technical factors indicate it should test $53.1 again. A close below this would call for $49.2, which is the last target protecting the $48.95 contract low.

Look for resistance at $57.5 and $60.05. A close over the latter would open the way for the $63.66 swing high to be challenged.

Take a trial of Kase’s weekly WTI and Brent Crude Oil Price Forecast.

Brent Crude Prices

Natural gas prices are still oscillating in the upward sloping range that began March 3 when the $2.641 swing low was made. The lower trend line of the formation, which connects back to the $2.589 contract low, was tested, but held again on Monday. Most pundits indicate the long-term fundamentals are bearish, but this begs the questions, why hasn’t the market broken lower yet? This is one of many areas that technical analysis can help answer that question and give us a good idea of where the market will go once it breaks out of this range.

The chart below tells us everything we need to know about the outlook for natural gas in the near term, and can give us an idea about the longer-term outlook too. This is a very short-term analysis, so we will focus on those factors. Technical factors are showing that the market does agree with the bearish fundamentals, and that a break lower should take place soon, but that there are still enough positive factors like late winter weather in the Northeast to support prices for now.

Natural Gas Forecast

The range that has formed over the past few weeks is an expanding wedge (shown in green), and a break out of this pattern will solidify direction for natural gas prices. The break out points for the pattern at $2.69 and $2.94 are in line with the 0.618 projections for the wave up from $2.589 (show in in red) and down from $3.045 (shown in blue). The confluence of these points tells us that a close below $2.69 would open the way for the 1.00 projection of $2.53, and a close over $2.94 would call for an extended correction to $3.10.

The expanding wedge and the Fibonacci wave projections give us a solid forecast once the market breaks out of the wedge. The wedge is a corrective pattern, and because the market entered the pattern after declining from $3.045, a break lower out of the wedge is favored. The negative bias is also confirmed by the KaseX’s most recent yellow and pink down triangles.

In summary, the near-term outlook is negative and a bearish U.S. Energy Information Administration (EIA) Natural Gas Weekly Update tomorrow would likely be the catalyst to achieve the expected break lower out of the expanding wedge. A close below $2.69 will confirm the break lower and call for at least $2.53. Conversely, a close over $2.94 would call for an extended correction to $3.10.

Take a trial of Kase’s in-depth weekly Natural Gas Forecast.

Take a trial of the KaseX trading indicator.