Kase’s senior analyst Dean Rogers reviews trade setups and price forecasts for e-mini S&P 500, AAPL, and MSFT, using Kase Wave Analysis and Kase StatWare.
Kase’s senior analyst Dean Rogers reviews trade setups and price forecasts for e-mini S&P 500, AAPL, and MSFT, using Kase Wave Analysis and Kase StatWare.
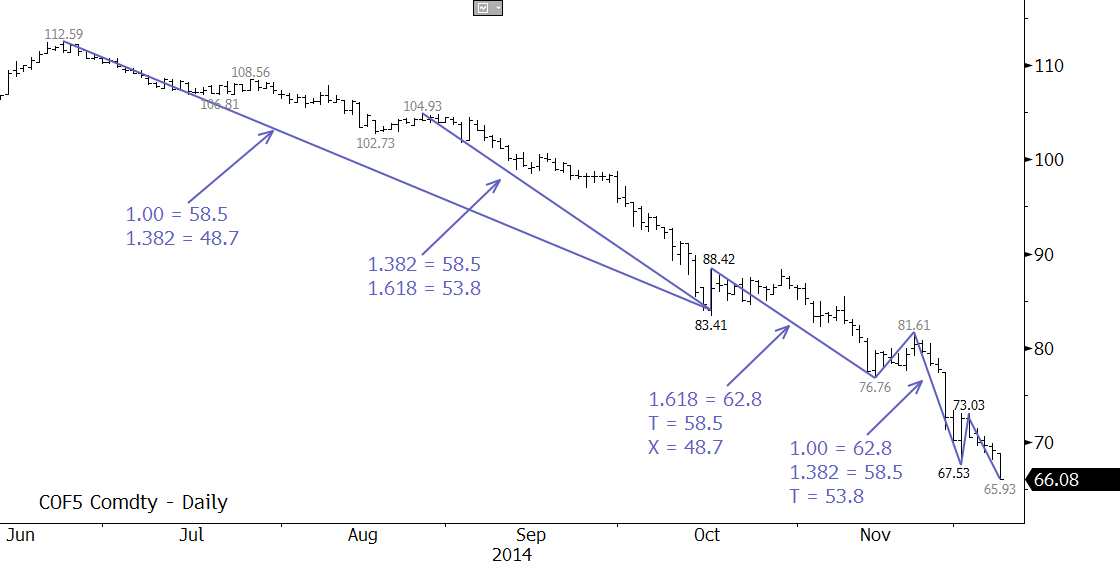
Coming into this week there was an outside chance that Brent would hold $67.0. However, prices settled below $67.0 on Monday. There is immediate support at $65.2 as discussed in this week’s Crude Oil Commentary, but the decline is now poised for at least $62.8 and likely $58.5 before a measurable retracement takes place. The key target is $58.5 because it is the most confluent wave projection and the equal to (1.00) target for the wave $112.59 – 83.41 – 88.42. A sustained close below this will open the way for $53.8 and $48.7.
There is very little evidence that the move down is going to end at this time. Prices are still deeply oversold and overdue for a correction, but until at least initial resistance at $70.5 is overcome, the move down is favored. Next resistance is $72.1, and a close over the this would call for and an extended correction to $75.1 and possibly $79.8.
For detailed weekly forecasts take a trial of our energy commentaries.
Kase’s senior analyst Dean Rogers reviews trade setups and price forecasts for e-mini S&P 500 and AAPL, using Kase Wave Analysis and Kase StatWare.
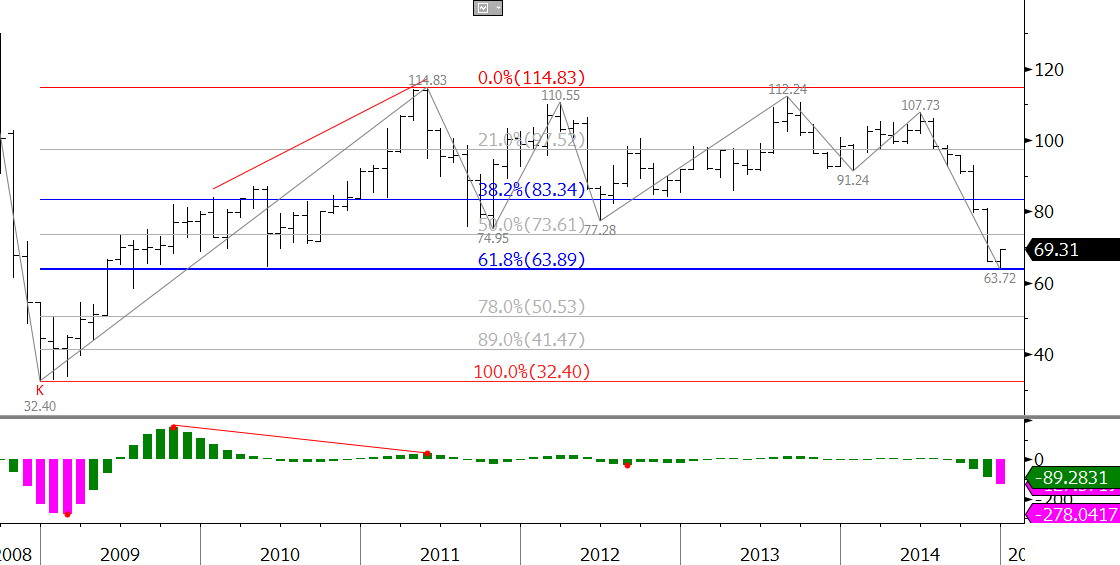
The outlook for WTI Crude Oil is negative, but prices met crucial support at $63.4. This is a confluent wave projection for the January contract, and more importantly, is the 62 percent retracement from the perpetual low of $32.4 to $114.83. In addition, the KaseCD is oversold on the monthly chart. The importance of $63.4 indicates it is a potential stalling point, but there is little technical evidence so far to definitively call for a bottom. A sustained close below $63.4 will call for $49.7. Key near term resistance is $73.3.
For more detailed energy forecasts please take a trial of the Energy Price Forecasts.
Kase’s senior analyst Dean Rogers reviews trade setups and price forecasts for e-mini S&P 500, crude oil, natural gas, AAPL, and VIPS using Kase Outlook, Kase StatWare, and KaseX.
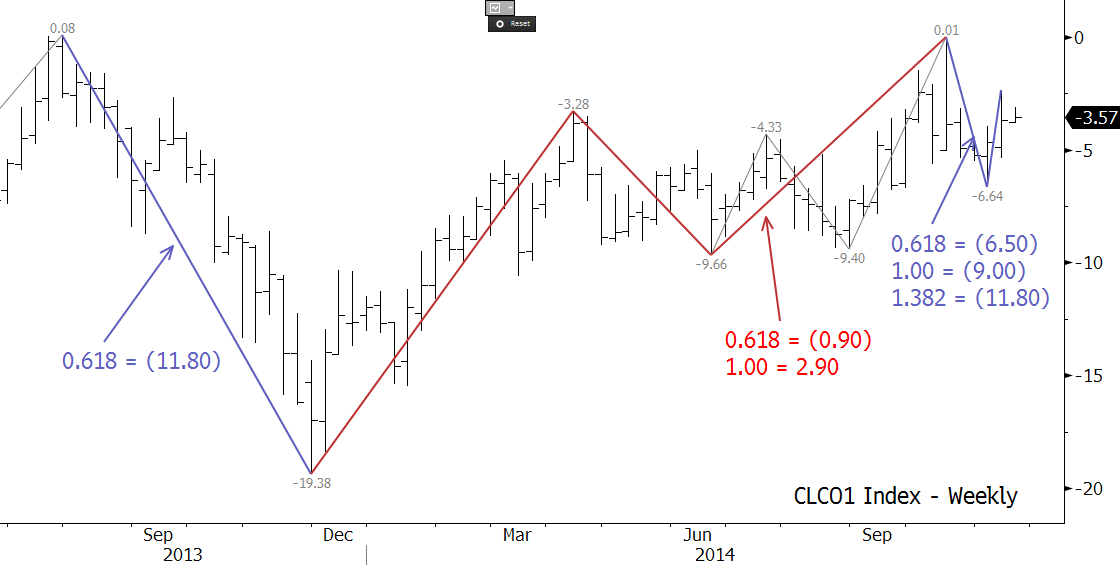
The WTI-Brent spread narrowed last week, but the move looks corrective. The spread will likely oscillate for the near-term, but ultimately odds favor a widening spread. The first target is (5.00), and a close below this would call for (6.50) and (9.00). Key long-term support is (11.80). This is a confluent wave projection and the 62 percent retracement from (19.38) to (0.01). Resistance at (0.90) should hold. A sustained close over (0.90) would open the way for 1.30 and 2.90.
For more information and to take a trial of Kase’s weekly energy forecasts please visit the Energy Price Forecasts page.
This is the fourth of a four part series on Kase Wave Analysis. In this video Kase’s senior analyst, Dean Rogers, shows how the Kase Wave Analysis can be combined with other technical factors and indicators to make trading decisions.
This is the third of a four part series on Kase Wave Analysis. In this video Kase’s senior analyst, Dean Rogers, demonstrates how to identify confluent support and resistance levels using Fibonacci wave projections. This is “where the rubber meets the road” with Kase Wave Analysis. Upon completion of this session you will be able to identify the key support and resistance levels using Kase Wave analysis.
Identify and remove wave projections that have been met by using swing highs and lows
Calculate True Range and determine an appropriate cluster size for confluence points
Demonstrate the ability to cluster wave projections into confluence points
Explain which support and resistance targets are the most crucial based upon confluence
This is the second of a four part series on Kase Wave Analysis. In this video Kase’s senior analyst, Dean Rogers, explains how to calculate the nine core Fibonacci wave projections that Kase uses for analysis. Upon completion of this session, you will be able to calculate these projections for a series of waves.
Identify the impulse and corrective legs of a wave
Show how the Fibonacci sequence and Phi are derived
Explain why the Fibonacci sequence and Phi are important for wave analysis
Explain the difference between impulse and corrective wave projections
Demonstrate the ability to calculate impulse and corrective wave projections
Assemble a grid of Kase’s nine core Fibonacci wave projections for a set of waves
This is the first of a four part series on Kase Wave Analysis. In this video Kase’s senior analyst, Dean Rogers, explains how to identify and pick waves. Upon completion of this session, you will be able to assemble a list of the most important waves for analysis.
Identify proper swing highs and lows
Recognize the X, Y, and Z points of a wave
Identify valid, invalid, and irregular waves
Demonstrate the appropriate point at which to drop to shorter bar lengths
Produce a list of all of the appropriate up and down waves