Short-Term Energy Forecasts – January 17, 2018

WTI Crude Oil Forecast

March WTI crude oil confirmed bearish daily KasePO and KaseCD weak divergences. A weak divergence is one that forms when the confirming bar closes in the opposite direction of the signal, in this case, up. Weak divergences generally do not follow through as well as normal divergences but do warrant caution. In addition, yesterday’s midpoint held, leaving the daily dark cloud cover reversal pattern intact.

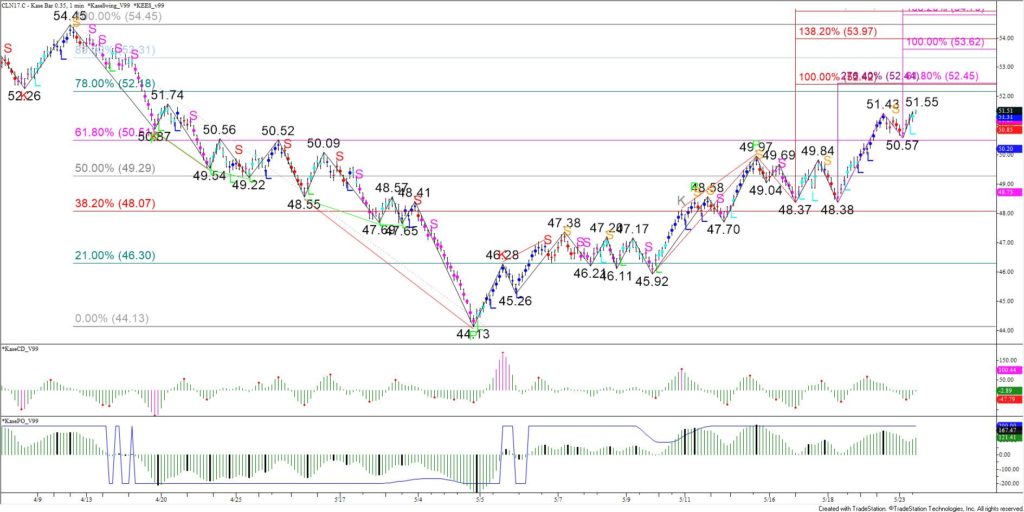
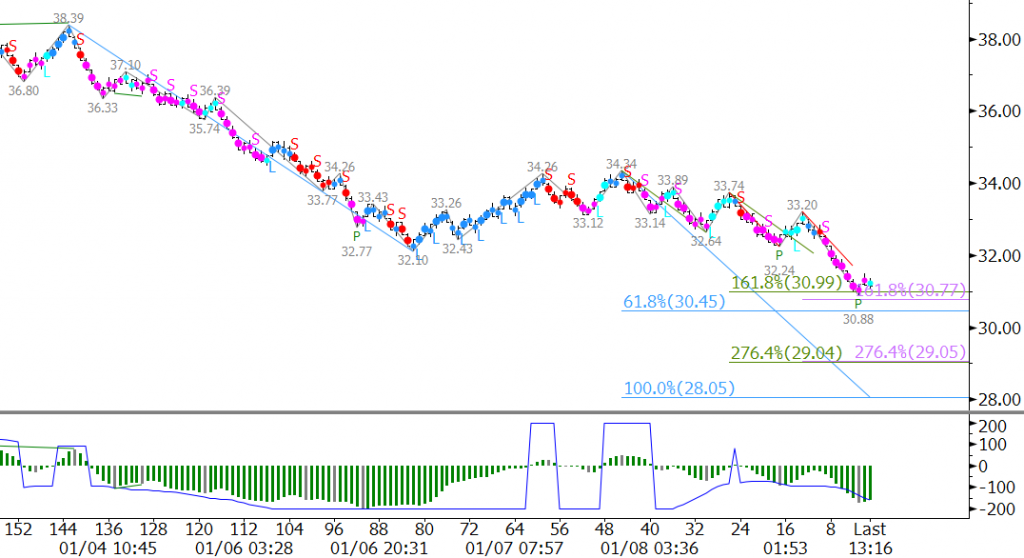
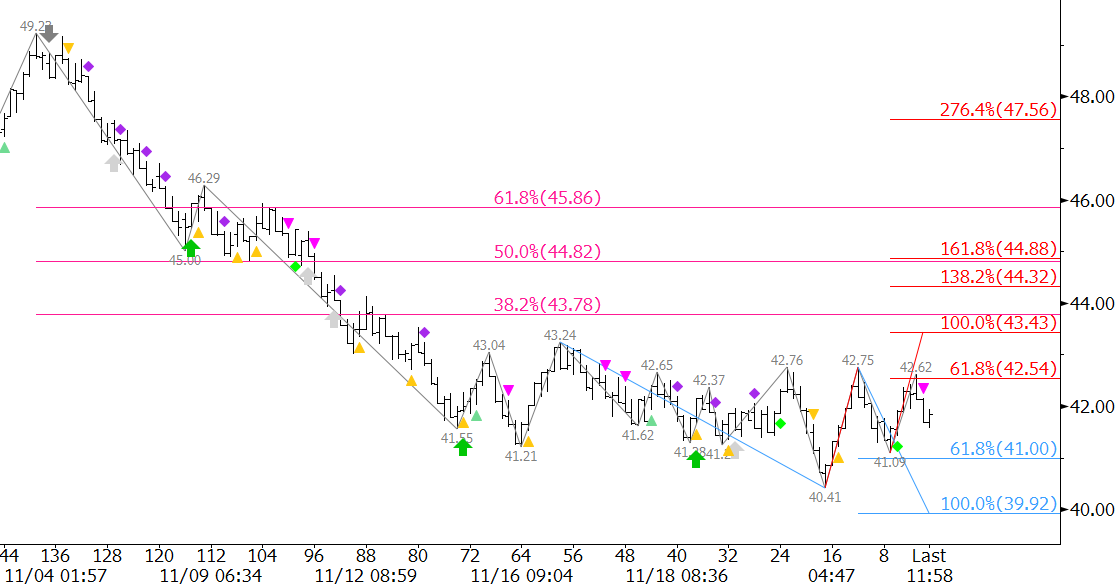
Tomorrow odds favor a continued decline to at least $63.2. This is the smaller than (0.618) target of the wave $64.83 – 63.25 – 64.14 and connects to $62.5 as the equal to (1.00) target. Settling below $62.5 would open the way for a larger pullback to $62.0 and even $61.6, the intermediate (1.382) and larger than (1.618) targets for the wave down from $64.83.

WTI Crude Oil Daily Chart

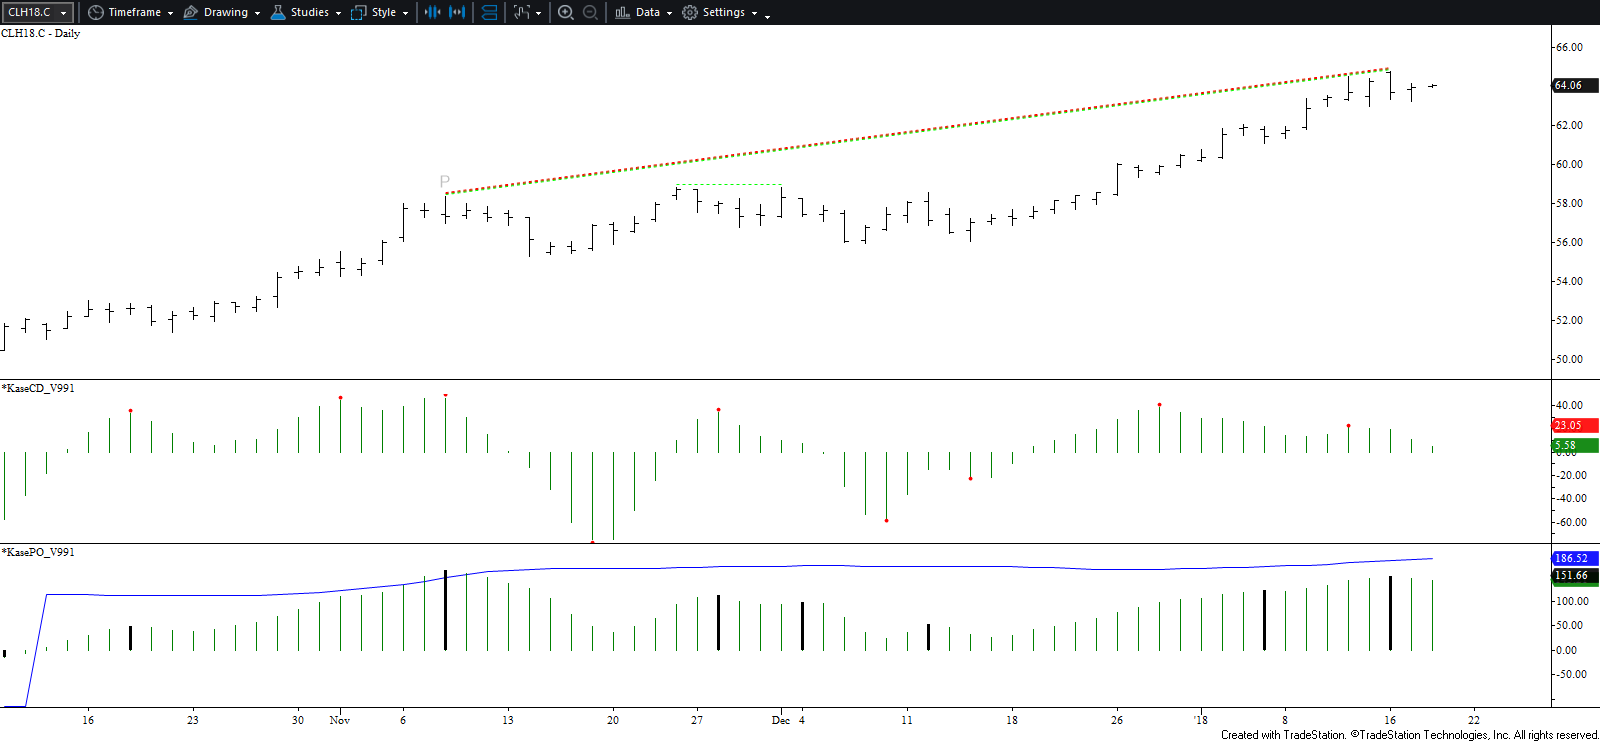
Should prices rise a bit higher first, look for $64.4 resistance to hold. A move above this would call for a new high of $65.1, a highly confluent and key threshold that connects to $66.3 and higher.

Natural Gas Forecast

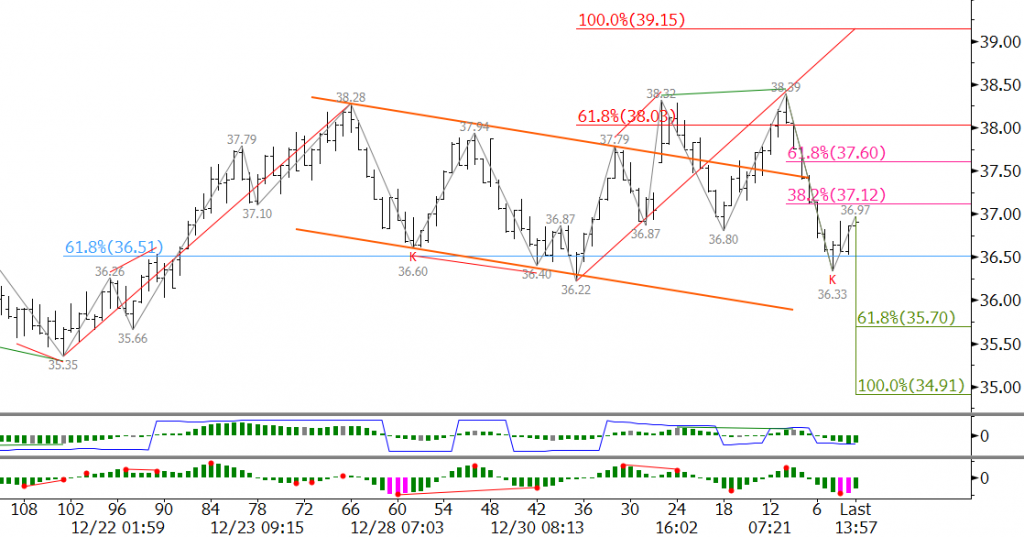
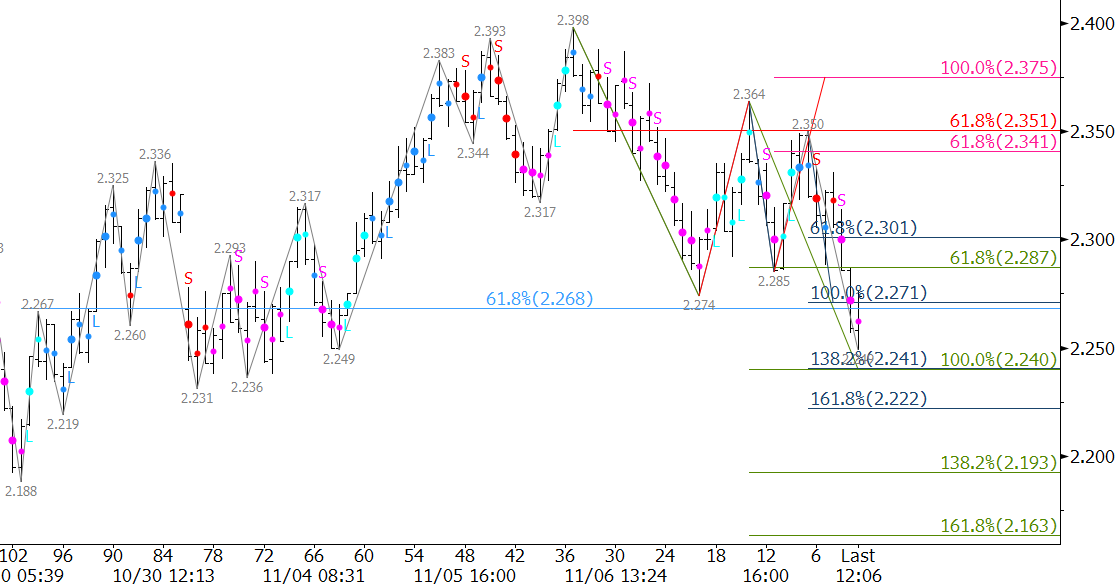
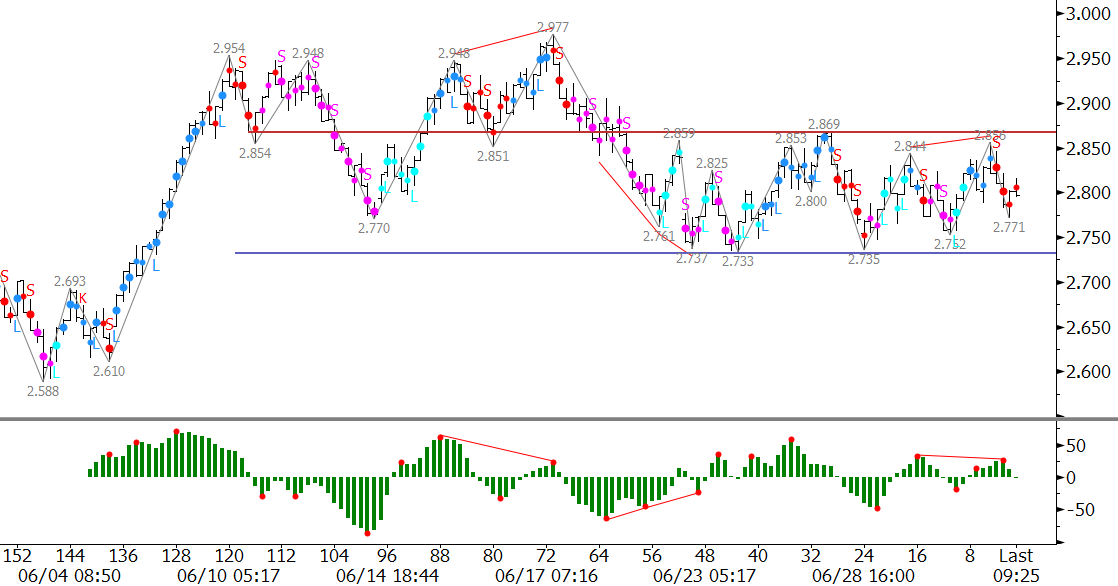
February natural gas a crucial target at $3.29 when it rose to $3.288 today. This is an extremely important area for natural gas because $3.29 is in line with the equal to (1.00) projection of the wave $2.562 – 3.097 – 2.746, the 62 percent retracement of the decline from $3.772, and the 200-day moving average. A sustained close above $3.29 would confirm the market’s bullish sentiment, opening the way for a larger scale move up to $3.49 and possibly higher over the next few weeks.

That said, given the importance of $3.29 caution is warranted. This is a potential area in which the move up could stall and another sizable correction take place. In addition, the KaseCD, MACD, and Slow Stochastic are set up for bearish daily divergence.

Natural Gas Daily Chart

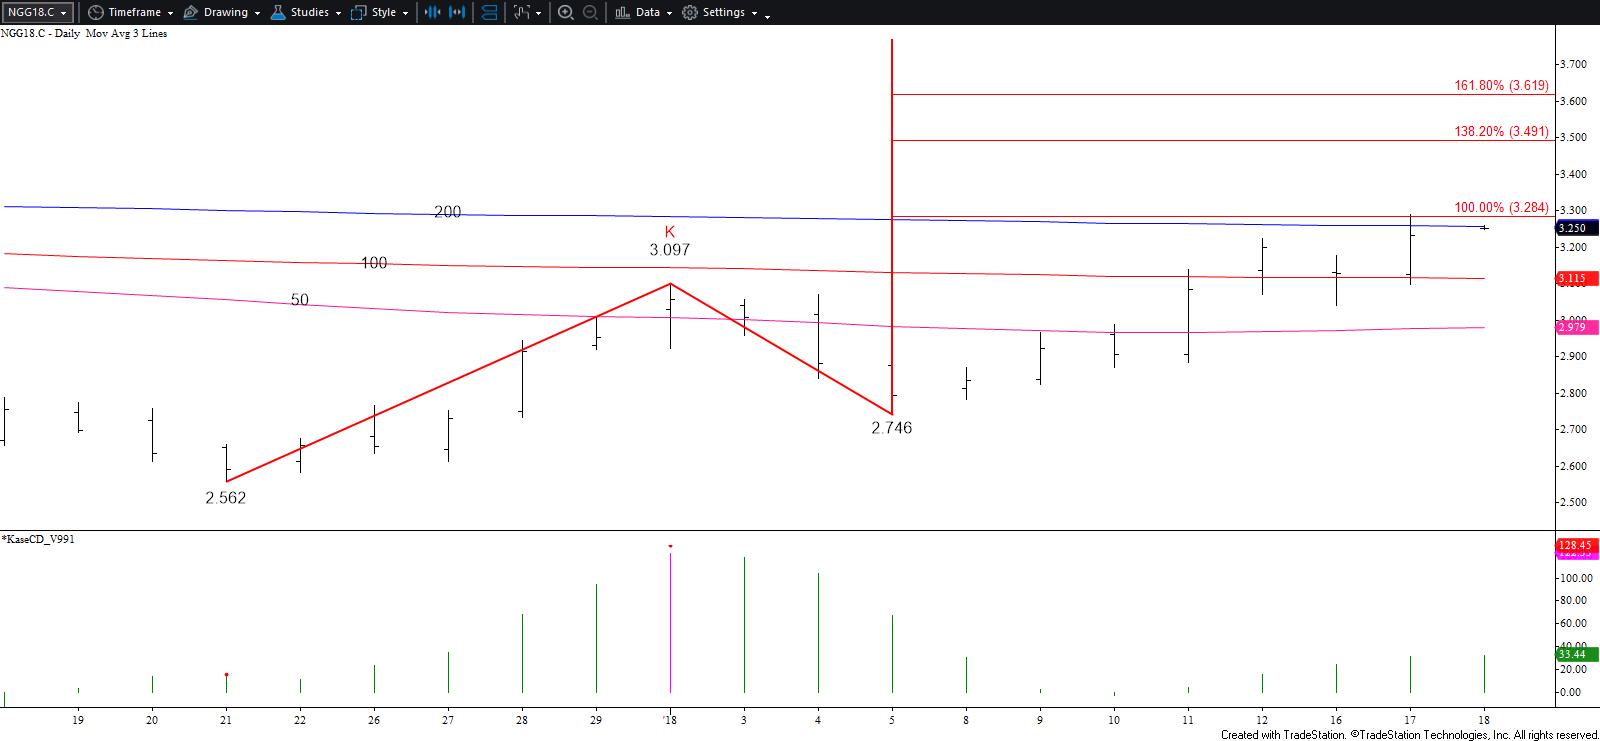
If prices are going to overcome $3.29 this week $3.18 should hold. Key support for the next few days is $3.13, today’s open and the 62 percent retracement of the move up from $3.039. A close below this would not doom the move up but would open the way for a more substantial correction to challenge support at $3.08 and even $3.01.

This is a brief analysis for the next day or so. Our weekly Crude Oil and Natural Gas Commentaries and daily updates are much more detailed and thorough energy price forecasts that cover key futures contracts, calendar spreads, and ETFs. If you are interested in learning more, please sign up for a complimentary four-week trial.

WTI crude oil continues to rise ahead of May 25’s OPEC meeting. Market participants are optimistic that OPEC will extend production cuts through the end of 2017. Many hope this will help to ease the global supply glut. U.S. production remains a concern, but for now, oil prices are poised to rise.

Most technical factors are positive. In recent days, July WTI sustained settles above the 62 percent retracement of the decline from $54.45 to $44.13. This is a strong indication that the recovery from $44.13 will continue.

July 2017 WTI Crude Oil - 35-Cent Kase Bar Chart
July 2017 WTI – 35-Cent Kase Bar Chart

Today’s break higher out of another intraday bullish flag and settle above Monday’s $51.43 high opens the way for $52.5. As shown in the chart above, this is a highly confluent wave projection that sits just above the 78 percent retracement of the decline from $54.45 to $44.13. The confluence of wave projections at $52.5 make it a potential stalling point.

Momentum on the KaseCD and KasePO is rising. The KasePO is setup for bearish momentum divergence, a reversal signal that forms when higher swing highs in price and lower swing highs in momentum are made. To confirm the divergence signal, a swing high in price and momentum must form before momentum rises to a new high.

The Kase Easy Entry System (KEES) also triggered a second class buy signal (light blue L) on the 35-cent Kase Bar chart today. A second-class buy signal indicates the majority of momentum indicators KEES examines are positive but that momentum on the synthetic longer bar length is negative. Traders using Kase StatWare may have taken a smaller position and placed a tighter trailing stop. Stops may be widened once the KEES permissions shift to first class (dark blue dots).

For the near-term, the $50.57 swing low is important support. A move below this would likely trigger the bearish KasePO divergence and open the way for a correction to $50.0 and possibly $49.6.

This is a brief analysis and outlook for the next day or so. Our weekly Crude Oil Commentary and daily updates are much more detailed and thorough energy price forecasts that cover WTI, Brent, RBOB Gasoline, Diesel, and spreads. If you are interested in learning more, please sign up for a complimentary four-week trial.

By Dean Rogers

China’s stock market plunge wreaked havoc on stock and commodity prices around the world last week. Fears of a further slowing economy in the world’s largest energy consumer along with weak manufacturing demand and the deepening global supply glut have recast a negative outlook on oil prices. The negative sentiment has been reflected in the technicals too as prices continue to fall.

February WTI fell to $30.88 on Monday and came close to meeting a crucial confluence point at $30.6. This is near the 0.618 projection of the wave $38.39 – 32.1 – 34.34, and is the last support protecting against a decline into the $20s. A close below $30.6 would call for at least $29.0 and likely $28.1. The latter is the 1.00 projection for the wave down from $38.39.

CLG6 20160111

The KasePO PeakOut (green P) indicates Monday’s $32.2 midpoint might be tested early Tuesday, but we expect this level to hold. Other than the intraday PeakOut there is little to no technical evidence that the decline is going to stall. Therefore, without some type of unexpected shift in the underlying fundamentals and/or technicals we expect to see prices fall into the $20s soon.

This is a brief analysis and outlook for the next day or so. Our weekly Crude Oil Commentary is a much more detailed and thorough energy price forecast. If you are interested in learning more, please sign up for a complimentary four-week trial.

By Dean Rogers

Tension between Saudi Arabia and Iran have the oil markets on edge. The global supply glut still hangs heavy and will reportedly last through 2016. However, recent the geopolitical tensions could push prices higher on fear and greed alone.

The indecisiveness is being reflected on the charts. WTI’s recent move up from $35.35 has been choppy, and is most likely corrective. However, it did form an intraday bullish flag last week. We do not put much weight into the flag though because its $36.22 swing low is only $0.87 higher than the $35.35 contract low.

CLG6 20160104

WTI broke higher out of the flag early Monday, but failed to close above the upper trendline of the formation. This was negative, and the move down was preceded by a bearish KasePO divergence. Another test of support at $36.5 took place, but has held so far on a closing basis. $36.5 is the 62 percent retracement of the move up from $35.35 to $38.39. A KCDpeak (oversold) signal formed at $36.33.

The price action has now given us a clearly defined range between $36.5 and $38.0. Odds favor a close below $36.5. This would call for $35.7, which then connects to $34.91. Trading will remain choppy though, and external factors combined with the KCDpeak could still push prices higher. A close over $38.0 would call for the correction to extend to $39.2. For now, we do not see WTI rising much higher than $39.2.

This is a brief analysis and outlook for the next day or so. Our weekly Crude Oil Commentary is a much more detailed and thorough energy price forecast. If you are interested in learning more, please sign up for a complimentary four-week trial.

Apple Inc. (AAPL)

Apple’s stock has taken a bit of a beating this year, and the holiday season has not been the boon loyal shareholders had hoped for. Most technical factors are negative and odds favor a continued decline. However, there are a few positive technical factors that indicate the upward correction that began on November 21 could extend first.

Overall, the outlook is for AAPL is negative and our technical price forecasting model indicates that over the next ten days there is a 70 percent chance for $106.4 and a 60 percent chance for $103.8.

AAPL - Table

The decline from $123.82 is forming a five-wave trending pattern, and $102.5 is the key support target for the formation. Wave III is currently in progress and $102.5 is a potential stalling point and beginning of Wave IV. Should prices settle below $102.5 look for Wave IV to form from $98.8.

There is some technical evidence that indicates AAPL could rise to $108.9 and even $111.0 before the first target at $106.4 is met. The decline stalled at $105.57 on Monday, formed a pseudo hammer, and has been flirting with Friday’s $107.5 midpoint. In addition, KaseX, shown in the chart below, confirmed a weak bullish turn threat (gray arrow). The signal indicates stops on the daily chart could be tightened to approximately $112.3, which is in line with our $112.6 resistance threshold.

AAPL

If the upward correction is going to extend in a significant manner it will need to close over at least $108.9 and very likely $111.0. The latter is strong near-term resistance that we expect to hold. A close over $111.0 would open the way for and extended upward correction to $112.6 and even $114.4.

Under Armour Inc (UA)

Since September UA’s stock performance has been dismal relative to that of their largest competitor, Nike (NKE), whose earnings hit the street Tuesday afternoon. NKE is pegged as one of the strongest performing stocks in the Dow Jones Industrial average, up 35 percent so far. The outlook for NKE, at least from a technical standpoint, is bullish. Conversely, we expect UA’s share price to continue to decline.

Most technical factors for UA are negative and odds are 75 percent for at least $78.1. This then connects to key support at $76.1. Longer-term odds favor $72.5 and $70.5, but we expect a correction to take place before the lower targets are met.

UA - Table

Kase StatWare, shown in the chart below, reflects the bearish sentiment with first class short KEES permissions (pink dots) on the daily bars for the past few days. That said, momentum on the KaseCD and KasePO are setup for divergence and the KasePO is nearing oversold territory. This means that a correction might take place soon.

UA

The one solid positive technical factor was November 22’s hammer. This is a reversal pattern that also indicates a correction might take place before UA falls below $78.1 again. The correction should hold $81.9, but $84.6 is the key threshold. A close over this would open the way for an extended upward correction before the decline ultimately continues.

These are brief technical analyses based upon Kase’s technical forecasting models and trading indicators KaseX and Kase StatWare. If you are interested in taking a trial of KaseX or Kase StatWare please contact sales@kaseco.com. We would love to get your thoughts about the forecasted targets and probabilities. Leave a comment or send them along with your request for a trial to sales@kaseco.com.

By Dean Rogers

January WTI futures met crucial support at $40.41 early Monday. This was the 1.00 projection for the wave $52.02 – 43.52 – 49.23. The subsequent move up was initially promising for bulls, but stalled at $42.75 before it could overcome $43.2 resistance.

CLF6 20151123-DIt is a tight call tomorrow, but we expect a test of $40.9 before the move up continues. This is confirmed on the intraday charts by the latest KaseX weak short signal (pink triangle). Support at $40.9 is near the 0.618 projection of the wave $42.75 – 41.09 – 42.62 and the $41.09 swing low. A close below $40.9 would call for $40.0 and possibly lower.

CLF6 20151123

Conversely, not all hope is lost for the upward correction to extend. The daily chart’s Kase Easy Entry System (KEES) permissions shifted from first class short (pink dots) to second class long (light blue dot). Therefore, there is still a reasonable chance for a close over $43.2 and an upward correction to $43.8, the 38 percent retracement from $49.23 to $40.41. A close over $43.8 would significantly increase the probability for an extended move to test major resistance levels.

This is a brief analysis and outlook for the next day or so. Our weekly Crude Oil forecast is a much more detailed and thorough energy price forecast. If you are interested, please sign up for a complimentary four week trial.

By Dean Rogers

As we stated last week, the natural gas call is extremely tight right now. The market can only tell us what it knows about itself, and right now the market is not sure what it knows.

The move up from $2.188 stalled at $2.398 on November 6, and since then prices have worked their way lower in an extremely choppy manner to test major support at $2.25. This level held on today’s close, so technically prices are still trading within the range.

The market is waiting on cold weather to push it higher, but today’s price action did not help short-term bulls. It will eventually get cold and prices will rise, but today’s decline to $2.25 puts odds slightly in favor (around 60 percent) of a decline to test least $2.20 and possibly $2.12 over the next few days.

NGZ5 20151111

That said, $2.25 is an extremely important and highly confluent wave projection and retracement that has been tested a few times and has held on a closing basis since the move up from $2.188 began on October 30. Therefore, caution is warranted, and given the circumstances, we would not be at all surprised to see $2.25 continue to hold.

From a trading strategy standpoint, this is a time that we would normally recommend sitting on the sidelines for a bit while waiting for a more concise direction and break out of the $2.25 to $2.37 range. Upon a close below $2.25 or above $2.37, a trade may be taken upon a confirming long or short signal from indicators like Kase StatWare or KaseX. Shorter bar lengths are also recommended because they will help limit risk and should be used to pinpoint entries and exits and determine stop levels until there is a close either below $2.12 or above $2.48. At that point a clear long-term trend will have been established and trades may then be scaled to longer bar lengths with wider stops.

This is a brief natural gas forecast ahead of tomorrow’s EIA report. Our weekly Natural Gas Commentary is a much more detailed and thorough analysis. If you are interested in learning more, please sign up for a complimentary four week trial.

By Dean Rogers

As discussed last week, everyone is looking for the natural gas bottom. I am sure no one wants me to step back onto my “picking bottoms is a dangerous game” soap box, so I will just reiterate that the best anyone can do is identify potential turning points and look to time entries and exits that fit their trading style, risk appetite, and goals.

With that in mind, let’s discuss the potential turning points for natural gas at today’s $2.263 swing low and at $2.11, the latter of which I think is the most likely point for a bottom to be made.

December’s wave structure down from $3.391 has unfolded in a five-wave pattern. We are not Elliott Wave fanatics or strict practitioners, but when a textbook pattern forms we pay attention.

Below are some of the basic Elliott Wave rules we abide by and look for when a five-wave pattern forms.

Basic Elliot Wave Rules, according to Kase:

  • A five-wave pattern is made up of three impulse waves and two corrective waves
  • Two of the three impulse waves should be equal in size
  • The impulse waves, labeled I, III, and V, should break down into five sub-waves.
  • Wave III cannot be the smallest impulse wave
  • Waves I, III, and IV should be proportional to one another (0.618, 1.00, 1.382, 1.618, etc.)

For the five-wave pattern down from $3.391 wave I met its 1.618 projection at $2.607 (end of wave III) and trend terminus (2.9693/3.3912) at $2.263 (potential end of wave V). The lowest that wave I projects is $2.12 as the 2.764 extension.

NGZ5 20151028

Given the importance of $2.263, the ticks up after the close, and oversold conditions on the KasePO, KaseCD, and slow stochastic, prices might turn higher from this level.

However, at this point there are not two equal waves. At $2.36 waves I and V were equal, but prices fell to $2.263. At $2.10 waves III and V will be equal. Therefore, based upon the basic Elliott Wave Rules, December will likely fall to the confluence point of $2.11 where wave I will have met its 2.764 projection and waves III and V will be equal.

From $2.11 we would expect to see a three-wave correction, and because of the time of year, a significant rally as the market heads into the winter heating season. A sustainable rally will be confirmed by a KasePO PeakOut, KaseCD KCDpeak, and %K over %D crossover as momentum rises out of oversold territory on the slow stochastic.

There are no guarantees that $2.11 will hold over the course of the longer-term, but this has become the most likely point at which a bottom will be made.

This is a brief natural gas forecast ahead of tomorrow’s EIA report. Our weekly Natural Gas Commentary is a much more detailed and thorough analysis. If you are interested in learning more, please sign up for a complimentary four week trial.

After the 4th of July weekend the energy markets, unlike the weather across most of the U.S., heated up. The lack of warm summer weather in key areas of the county has given way to lower prices for natural gas. August natural gas futures finally closed below $2.73 on Tuesday and Wednesday. The move has been quiet relative to the noise being made by crude oil, but the break lower indicates prices should continue to decline. That said, the bullish KaseCD divergence and KasePO PeakOut (oversold signal) on the $0.035 Kase Bar chart indicate the decline will be a grind.

natural gas prices

The wave $2.977 – 2.733 – 2.885 took out its 0.618 projection at $2.73, therefore odds favor at least $2.64, its 1.00 projection. This is a highly confluent and important target that protects the $2.588 swing low. We expect to see a bounce from $2.64 given its importance. A close below $2.64 would call for $2.55 and $2.50.

The 38 percent retracement from $2.885 to $2.676 is $2.76. Key near-term resistance is $2.81, the 62 percent retracement. Both levels are in line with the two previous intraday swing highs of $2.756 and $2.80. A close over $2.81 is unlikely unless tomorrow’s Energy Information Agency (EIA) report is extremely bullish.

This is a brief natural gas forecast ahead of tomorrow’s EIA report. Our weekly Natural Gas Commentary is a much more detailed and thorough analysis. If you are interested in learning more, please sign up for a complimentary four week trial.

Markets are rarely more balanced that what we have experienced for natural gas over the past few weeks. After August failed to overcome $2.95 it stalled at $2.73, and is now in a mini-range between $2.73 and $2.87. Considering this week marked the end of the month and quarter, and is shortened due to the 4th of July holiday, a breakout will likely be delayed until next week.

The market is waiting for factors like summer weather and/or supply/demand issues to give us a breaking. The longer it delays the move up though, the more prices will erode away until it is too late to make a meaningful push higher.

It is still a bit early for the market to give up on a summer rally, but based on many technical factors we favor a break lower out of the mini-range between $2.73 and $2.87. This morning’s failed attempt to overcome $2.87, bearish KaseCD divergence and first short signal confirm our call. This would open the way for a confluent $2.64 target.

natural gas prices

Should prices close over $2.87 look for another test of $2.95, which is the key threshold for a push to levels above $3.00 and a summer rally.

This is a brief natural gas forecast ahead of tomorrow’s EIA report. Our weekly Natural Gas Commentary is a much more detailed and thorough analysis. If you are interested, please sign up for a complimentary four week trial.