m
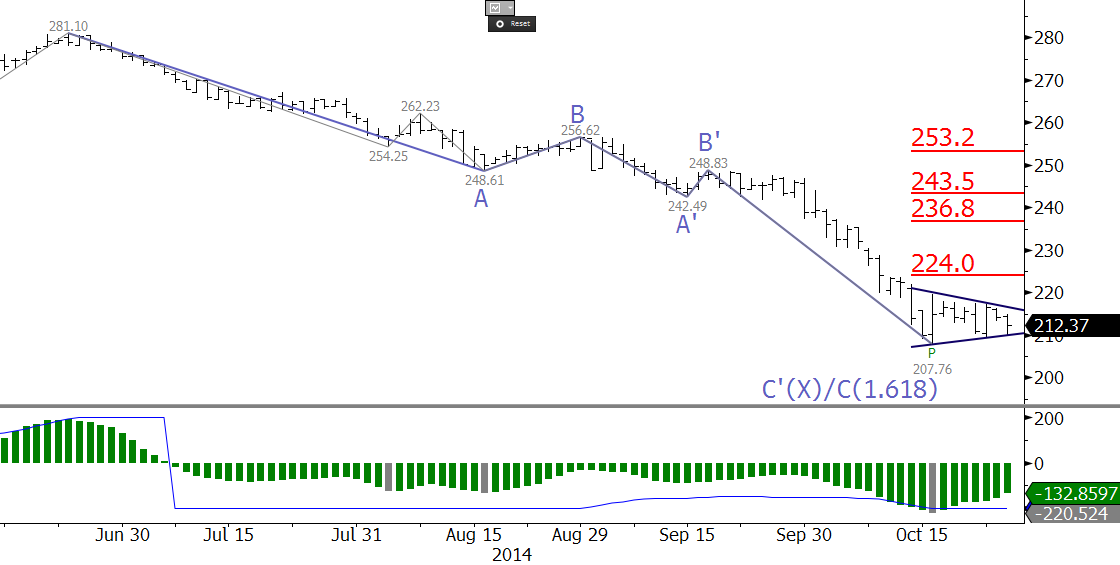
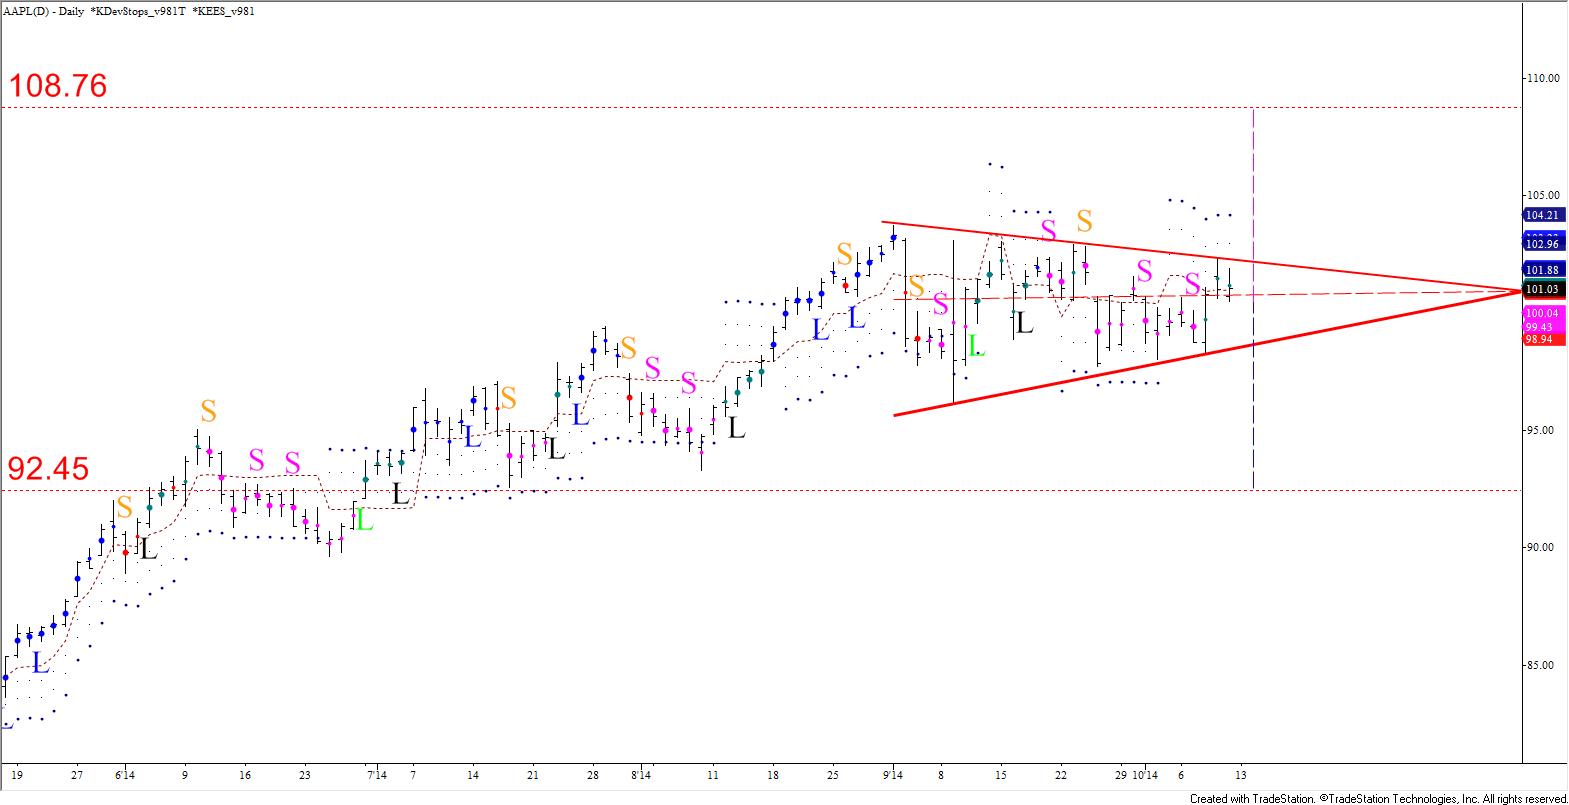
The symmetrical triangle is a classic geometric pattern used by technical analysts to determine market direction, and right now, AAPL has formed a textbook example. Symmetrical triangles, or coils, show the narrowing boundaries of a trading range very clearly, and form during period of uncertainty. These patterns generally break in the direction of the dominant trend, which in the case of APPL, is bullish. However, these patterns are not as reliable as other continuation patterns like flags, pennants, and wedges. According to Thomas Bulkowski, the overall performance rank for a break higher out of a coil is 16 out of 23 bullish patterns and for down breakouts is 15 out of 21 bearish patterns (thepatternsite.com/st.html). The pattern can also be used to identify targets by adding and subtracting the maximum width of the pattern from the apex. The symmetrical triangle, its apex, and its targets are shown in the chart below.
Psychologically, the symmetrical triangle means a few things for AAPL right now. Traders are uncertain about the near term future of AAPL’s stock price. The dominant trend is bullish, and there is little technical evidence that the move up is going to end. However, several factors (whether fundamental or technical) have led to this indecision. Therefore, some participants are poised for a deeper correction first. The break one way or the other will come soon because AAPL is quickly nearing the apex of the symmetrical triangle.
From a trading and analysis standpoint, the symmetrical triangle is small gift from the trading gods. The symmetrical triangle indicates odds favor a break higher, but again, these are not the most reliable continuation patterns. The important thing is that the breakout levels are known, and once one of those thresholds is broken, a long or short position may be established upon confirming ‘buy’ or ‘sell’ signals. These signals could come from many different methods and technical indicators. The chart above shows the Kase Easy Entry System (KEES), which is part of the Kase StatWare indicator package.
KEES examines multiple momentum indicator crossover permissions, a longer bar length filter, bar structure, and swings. It then distills all of this information down into very simple color-coded dots (red and pink for short, blue and cyan for long) and potential entry points that are marked by an L (for long) or an S (for short). Essentially, once AAPL breaks out of the formation, a trade may be taken upon a confirming L on a break higher, or S on a break lower.
It is important to note that there have been multiple L and S signals throughout the formation of the symmetrical triangle. One may have taken these signals, but essentially would have been whipsawed on several occasions. Alternatively, one could drop into an intraday chart, and trade the swings. That is perfectly acceptable. However, the third alternative, and the one described above, is to sit back and wait for the break higher or lower out of the symmetrical triangle. In this case, the trade entry point might not be quite as optimal, but the money saved on the whipsaws alone will be worth the wait. In addition, once the formation breaks out of its boundaries there are very clear targets at $108.76 and $92.45. These levels can be used as profit targets, or to calculate risk/reward ratios. They are also confirmed by other technical factors like wave projections and retracements, but that is a conversation for another blog post, on another day.
In summary, within the next week or so, AAPL will break either higher or lower out of this very classic symmetrical triangle formation. Odds favor a break higher and for AAPL to rise to the $108.76 target, but as stated, these are not always the most reliable patterns. Therefore, the most important aspect, is that the boundaries of the range are known, and once the pattern does break higher or lower, a tradable direction will be established for the near-term.
Copyright Kase and Company, Inc. 2014. All rights reserved. No part of this publication may be reproduced, stored in a retrieval system, or transmitted, in any form or by any means, electronic, mechanical, photocopying, recording, or otherwise, without the prior written permission of Kase and Company, Inc. Kase and Company, Inc. work products including, but not limited to, reports, comments, forecasts, analysis, and screenshots whether oral or written are “publications” and are not to be construed in any way as “consulting”. Charts created using TradeStation. ©TradeStation Technologies, Inc. 2001-2014. All rights reserved. No investment or trading advice, recommendation or opinions are being given or intended.