By Cynthia Kase
Read on TraderPlanet.com
“Ask Kase” and your question may be chosen as the subject of a future column (askkase@kaseco.com).
The media sector has been hit by fears about streaming video and unbundling. Disney reported decent revenues, but is trading at a relatively high multiple. With high hopes that Star Wars will boost Disney’s stock price, is the decline now a time to buy in?
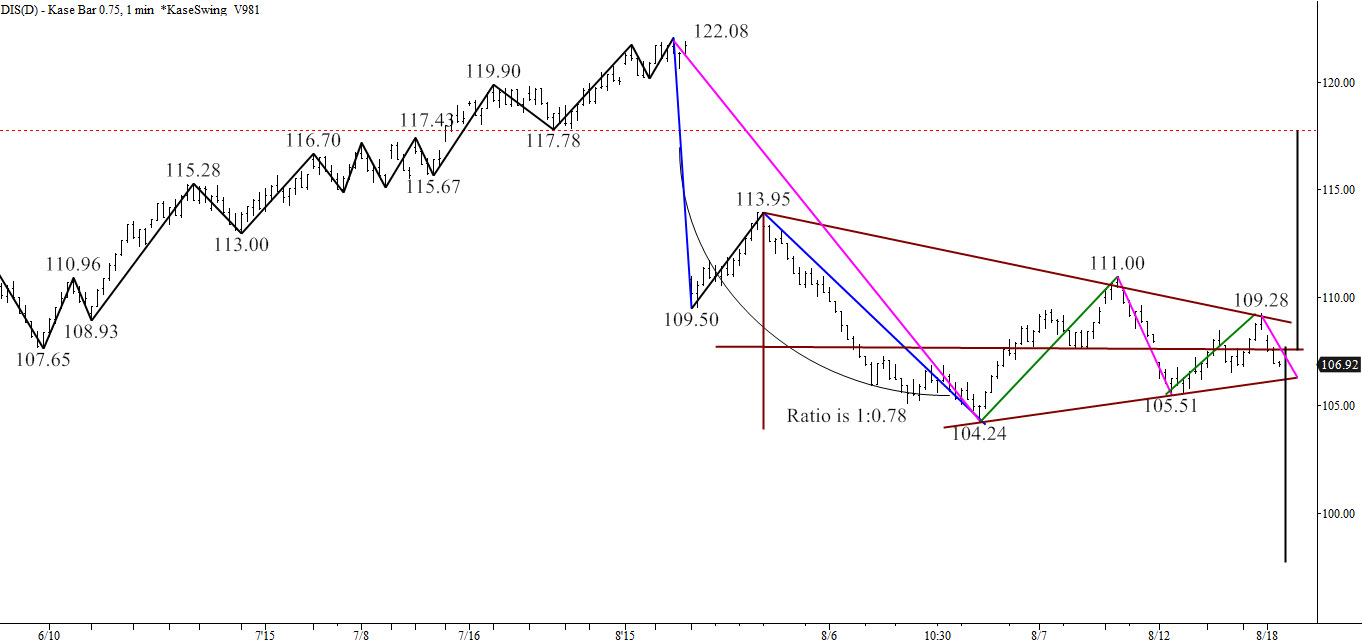
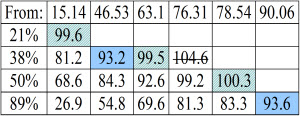
Disney climbed from a $15.14 low back in 2009 to a $122.08 high on August 4, only to suffer an $11 plus down gap on the following day’s open. This precipitous drop, continuing to $104.24, disconnected the following price action from the previous uptrend. Though the dropped seemed large, it only retraced 38 percent of the rise from $78.54.
Aside from waves, the only key pattern is an intraday coil, shown in the chart below (dark red). Though coils are signs of uncertainty, this one appears to be a failed attempt to recover. The last wave up in green would be expected to exceed the earlier one, which did not happen
$0.75 Kase Bar with Coil
Charts created using TradeStation. ©TradeStation Technologies, Inc. 2001-2015. All rights reserved. No investment or trading advice, recommendation or opinions are being given or intended.
If there’s a break higher, though, I’d buy above $111 and increase my position above $117.9. Otherwise, I’d watch $100. If it doesn’t break, then I would time in on signals as prices rise from a short-lived downside test. I would buy on a bounce up from $93.4. But if this lower “drop dead” support breaks, I’d watch Fantasia instead of DIS for now.
Here are the details. As the coil’s apex is approached, a breakout is expected, with upside and downside targets $117.9 and $97.8 respectively.
The decline stalled before hitting its 21 percent retracement, $100. This is a hugely important price because it is the first retracement of the entire move up.
Retracements to $122.08
$100 is also a key extension for the waves marked in magenta in the chart. The wave from $122.08 extends to $100 as its 0.62 projection, and the Phi corrective projection. The 1.62 extension for this wave is $93.4.
The magenta wave down from $111 extends to $100 as its 1.38 projection. The last small wave from $109.28 targets $100 as its 2*1.38 extension. (For more on wave targets, check out Kase on Technical Analysis).
The waves shown in blue calculate to immediate support at $101.5. This is also Kase DevStop3 on the weekly chart. If this level isn’t broken on a move lower, then the tone will improve. It’s likely though, if this is tested, $100 will be met. $100 is also a psychological barrier.
Below $100, there’s a wave projection to $97.6, the coil’s lower target, but a break of $100 will likely lead to the $93.4 confluence point.
On the upside, the recent $111 swing poses initial resistance both structurally and as a wave target. Above this there’s a confluence point at $114.9, but the big number is $117.9, coincident with the coil’s upper target. Above this, a resumption of the uptrend would be expected, with reasonably confluent targets up to about $133.
Send questions for next week to askkase@kaseco.com, and learn more about Kase’s services please visit here.


 by
by 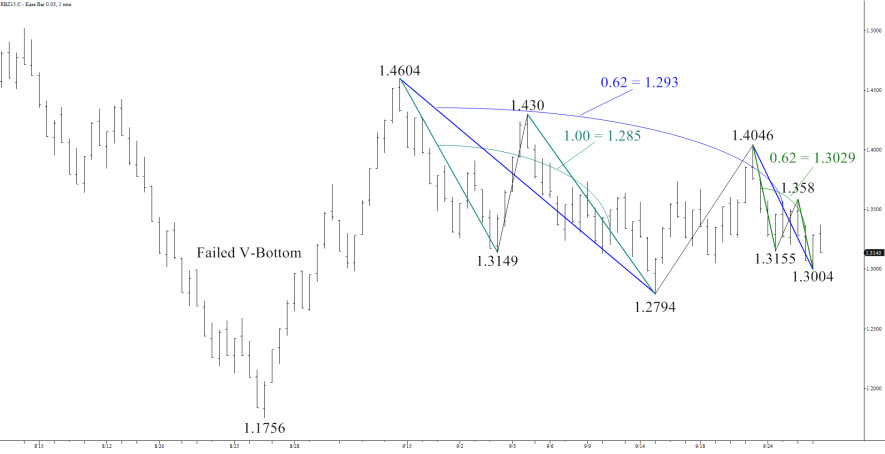

 by
by 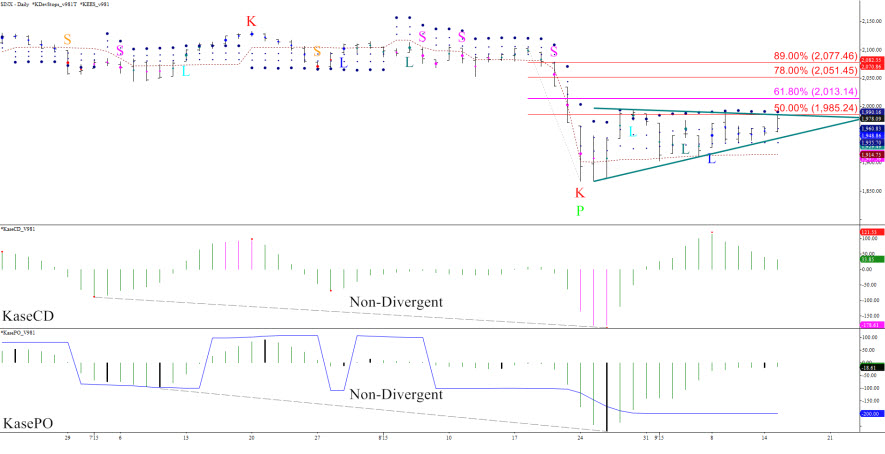 Charts created using TradeStation. ©TradeStation Technologies, Inc. 2001-2015. All rights reserved. No investment or trading advice, recommendation or opinions are being given or intended.
 By
By  Charts created using TradeStation. ©TradeStation Technologies, Inc. 2001-2015. All rights reserved. No investment or trading advice, recommendation or opinions are being given or intended.
 By
By