Technical Factors Call for WTI Crude Oil Correction to $56.2

For the past few weeks WTI crude oil prices have risen significantly, and for the first time since early December 2014 prices closed above $60.0 last week. However, many traders are questioning the long-term validity of the price rise continuing due to concerns of a persistent supply glut, and the technical factors show that the market reached a crucial decision point at $62.58 last week.

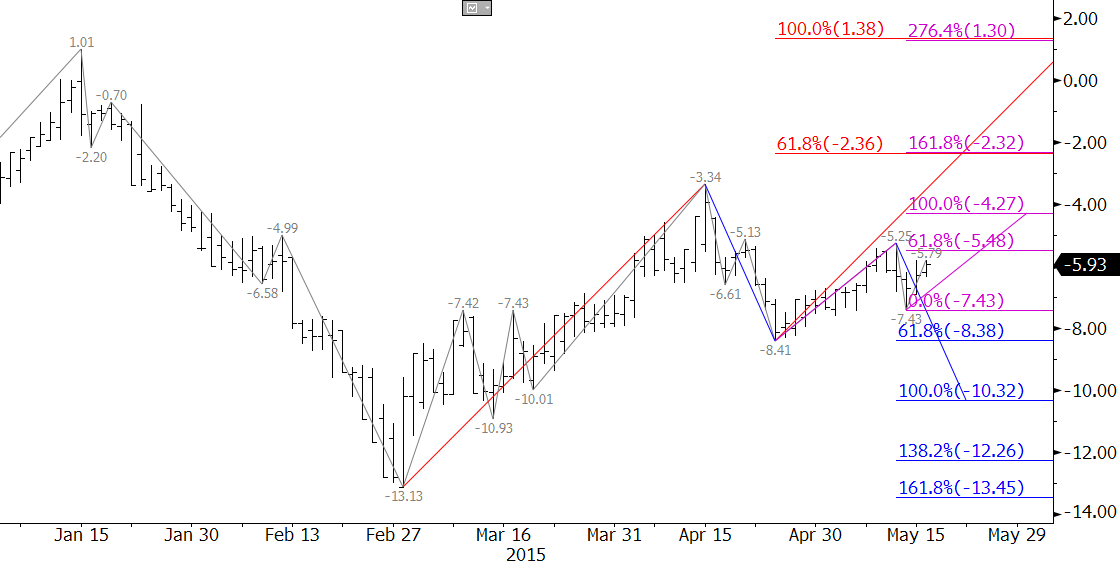
The June WTI futures contract met crucial resistance at $62.58 on Wednesday, May 6, and as called for in our weekly Kase Crude Oil Commentary, prices have begun to pullback in a corrective manner. The correction is taking place after a blow-off high and evening star setup formed that same day. The evening star (some might say shooting star) was both completed and confirmed on Thursday when prices closed below the midpoint and open of Tuesday’s Harami bar. In addition, bearish divergences on the KaseCD and KasePO were confirmed on Friday. The combination of negative short term technical factors indicates the downward correction should extend and will likely form Wave IV of a longer-term five wave formation that projects to target in the mid-to upper $60s and even the low $70s.

WTI Crude Oil

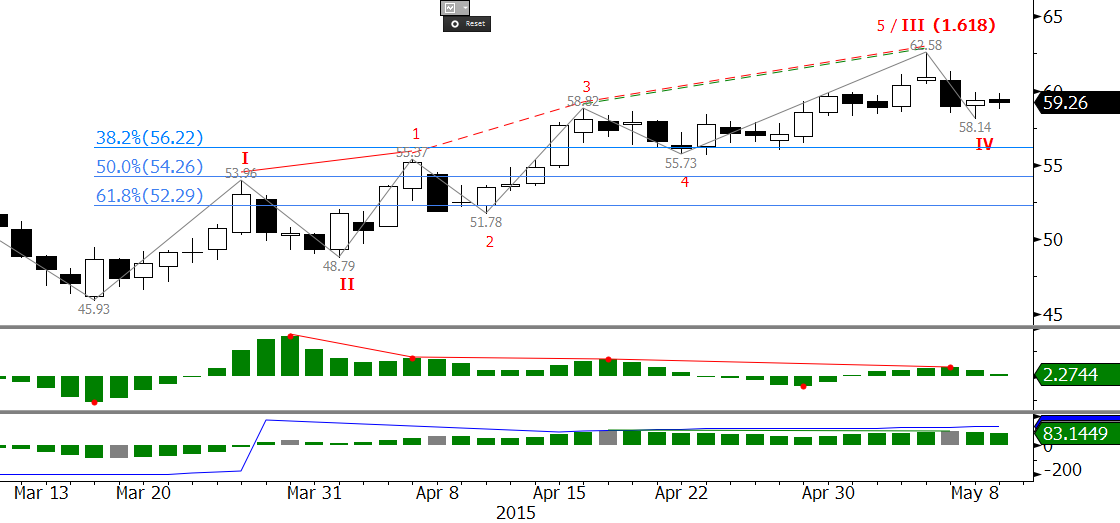
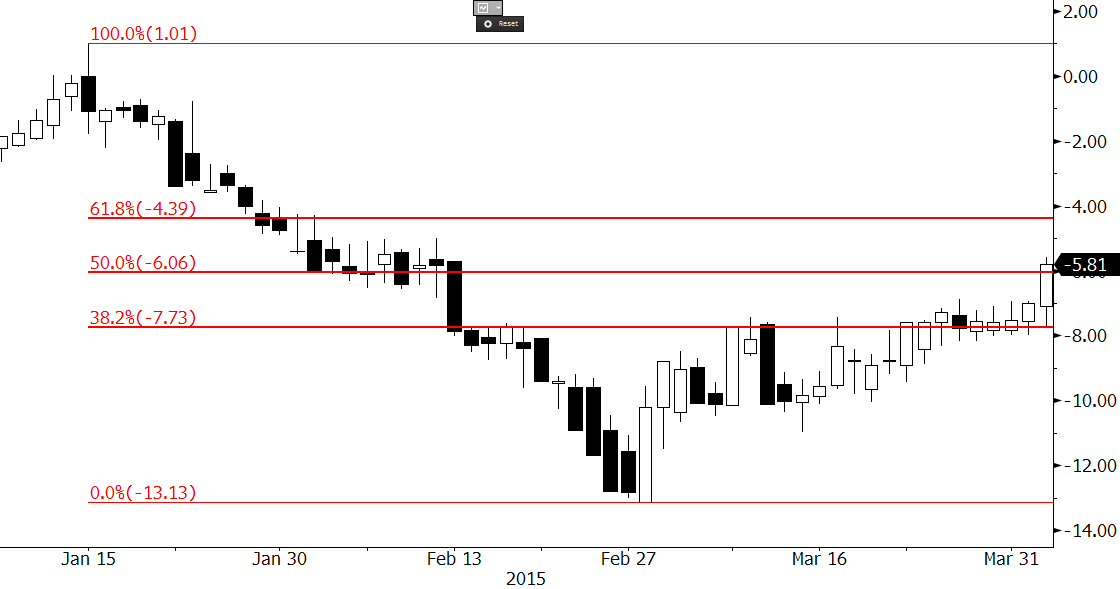
We expect the pullback to challenge at least $56.2. This is the 38 percent retracement of the move up from $45.93 and is near the bottom of the sub-wave 4 of III. If prices are going to extend to new highs in the next week or so, $56.2 must hold. Otherwise, a close below $56.2 would call for the 50 and 62 percent retracements at $54.3 and $52.3. For now, it looks as though $56.2 will hold. The long-term outlook would only shift back to being bearish upon a close below $52.3. We do not expect to see a decline of that magnitude.

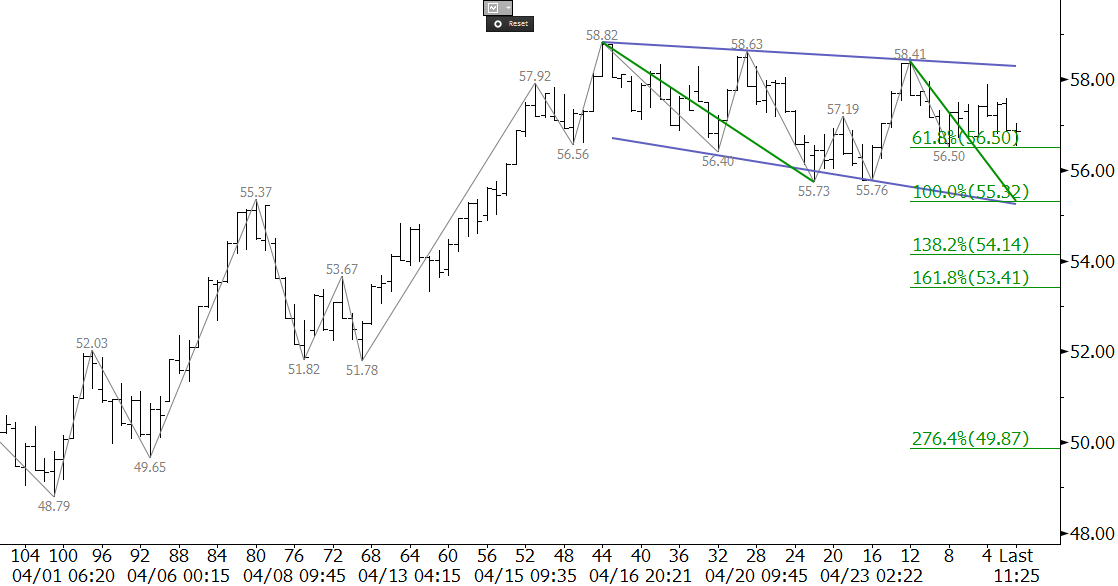
Today’s decline was nominal, so the next few days will be crucial for the near-term direction. A close over last Thursday’s $59.82 midpoint would shift the near-term outlook back to positive, call for another test of $62.5, and likely open the way for the five-wave pattern to unfold to upper targets of $66.8 and $71.5 over the course of the next few months.

Take a trial of Kase’s weekly crude oil forecasts to receive more in-depth analysis every week.

June WTI crude oil has oscillated in the range of a broadening wedge over the last eight trading days. The pattern is bullish, but the euphoria of WTI’s recent price surge is waning. Mixed technical and fundamental factors indicate the pattern will fail if the $58.41 swing high is not overcome soon.

Key technical support for the near term is $55.3 because it is the 1.00 target for the wave down from $58.82, and intersects with the lower trend line of the expanding wedge. This wave stalled at its 0.618 projection of $56.5, so the market is sitting on the teetering edge of a decline to $55.3 or push higher to overcome $58.41. A close over $58.41 would confirm a break higher out of the wedge and would open the way for an extended upward correction. A move below $56.5 would open the way for $55.3 to be challenged. Overall, odds are still slightly in favor of the move up and a break higher out of the wedge, but a close below $55.3 would indicate the pattern has failed.

For more detailed weekly analyses of WTI, Brent, and Natural Gas please take a trial of the Kase Energy Forecasts.

WTI Crude Oil

The WTI-Brent spread narrowed to ($5.81) on Monday and will likely continue to narrow over the next few days as it approaches a key threshold at ($4.40). This is the 62 percent retracement of the decline from $1.01 to ($13.13). The narrowing spread is currently a result of strengthening WTI prices and a weaker outlook for Brent. Ultimately, weaker Brent prices and a narrow spread could put another wave of downward pressure on both WTI and Brent. It will likely take at least a few more days, but look for the spread to stall near ($4.40).

Take a trial of Kase’s Weekly Crude Oil Price Forecasts.

WTI-Brent Spread

WTI crude oil rose for a second straight day due to the declining dollar. The long-term bias is still negative, so the move up is corrective. However, mixed fundamental and technical factors indicate the correction should extend to at least $48.2 before settling into another trading range. This is the 1.00 projection for the wave up from $44.03 and the 38 percent retracement of the decline from $54.0. A close over $48.2 would call for $50.4, the 1.618 projection and the 62 percent retracement. Look for immediate support at the $45.33 and $44.77 swing lows.

Take a trial of Kase’s weekly energy forecasts.

WTI Crude Oil

Most technical factors now indicate that WTI’s upward correction has failed and that the near term WTI price outlook is negative again. Monday’s decline broke the lower trend line of a bullish ascending wedge. Formations like this break higher around 75 percent of the time, so failures like this do not generally bode well for a continued price rise.

More importantly, WTI prices are about to take out the crucial $48.2 swing low. This level is important because it is the 1.00 projection for the wave $55.05 – 48.2 – 54.92, the 62 percent retracement from $44.37 to $55.05, and the key swing low for the upward wave formation from $44.37. Taking out $48.2 would call for at least $45.5, and very likely to $43.8 and lower.

The only real hope for a continued WTI price rally in the near term would be for prices to hold $48.2. Look for resistance at $51.0 and $52.5. A close over $52.5 would call for another test of the triple top of $55.0.

For a more in-depth analysis, take a free trial of Kase’s weekly crude oil price forecast.

wti price


WTI crude oil is trying desperately to show that a bottom has been made and that a recovery is underway. WTI is testing a crucial decision point at $54.0. This is the 0.618 projection for the wave, $43.58 – 54.24 – 47.36. Most waves that meet the 0.618 projection extend to at least the 1.00 projection, in this case, $58.0. However, a pullback will usually take place first.

Support at $49.9 should hold, but the $47.36 swing low is the level that must hold for the near-term outlook to remain positive. A close below this would negate the wave up from $43.58, and call for a continued decline.

Take a free four week trial of Kase Energy Price Forecasts.

CLH5

February 2015 WTI crude oil broke lower out of a coil formation on Friday and continued its decline on Monday, December 29. The target for the coil is $49.8, and is in line with a highly confluent $49.7 objective that we have discussed as a potential stalling point for several weeks. A close below $49.7 would open the way for $46.9 and $45.5. Initial resistance is $56.0, the apex of the coil. Key resistance is $61.8, which is near the coil’s $62.1 upper target.

Take a trial of Kase’s weekly energy forecasts to get more in depth analysis, targets, and probabilities.

clg5

The outlook for WTI Crude Oil is negative, but prices met crucial support at $63.4. This is a confluent wave projection for the January contract, and more importantly, is the 62 percent retracement from the perpetual low of $32.4 to $114.83. In addition, the KaseCD is oversold on the monthly chart. The importance of $63.4 indicates it is a potential stalling point, but there is little technical evidence so far to definitively call for a bottom. A sustained close below $63.4 will call for $49.7. Key near term resistance is $73.3.

For more detailed energy forecasts please take a trial of the Energy Price Forecasts.

CL1