Natural Gas Forecast: October Looking for $3.12

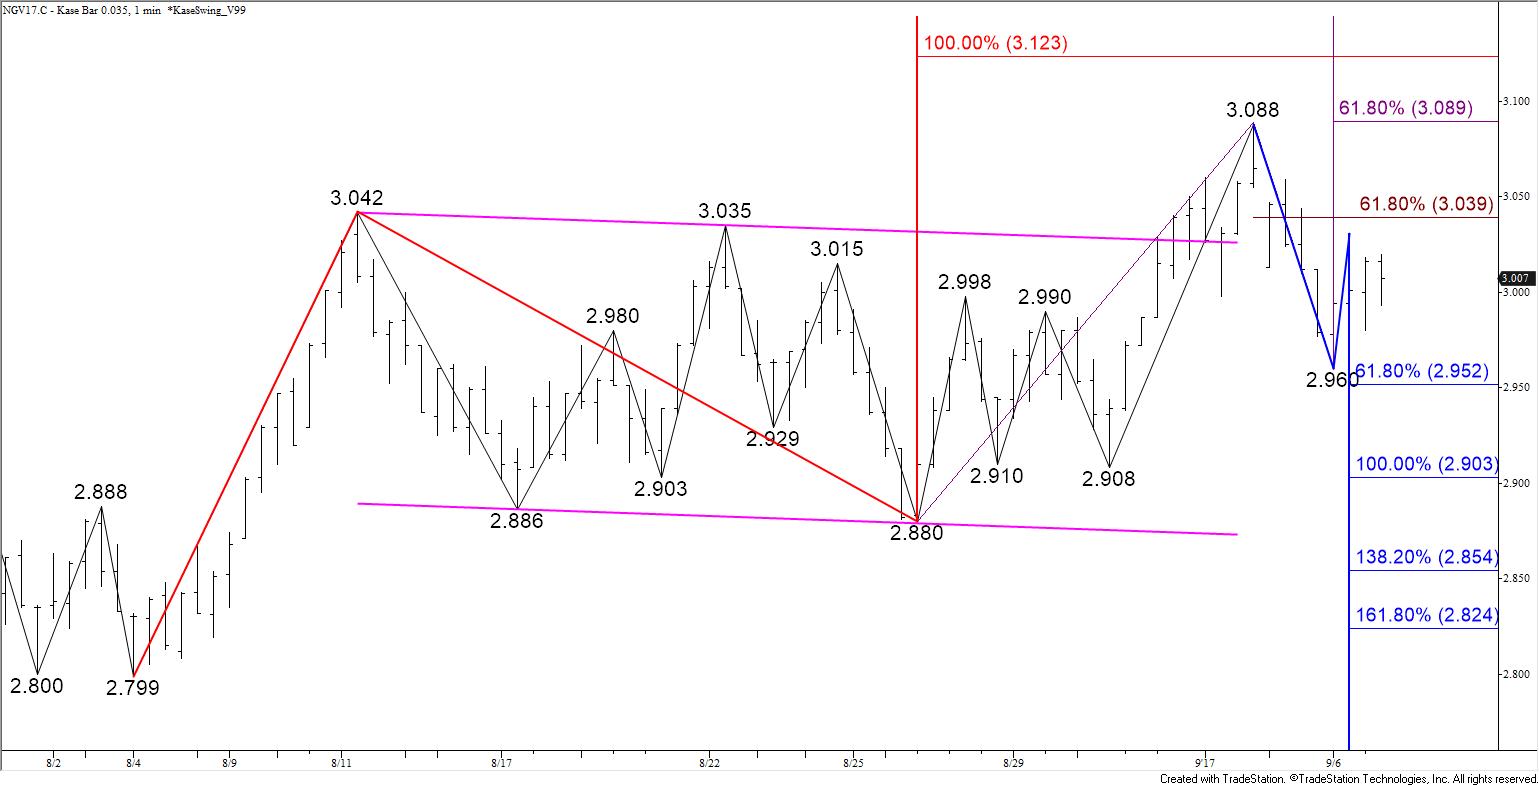
October natural gas settled above $3.03 and fulfilled the $3.06 target. The next objective is $3.09, the equal to (1.00) target of the wave $2.88 – 3.088 – 2.885. The key objective is $3.12, the smaller than (0.618) target of the wave $2.799 – 3.042 – 2.88. This has been strong resistance all summer for October and the continuation chart, making it a decision point for a larger scale move up and sustained recovery.

Natural Gas Daily Chart

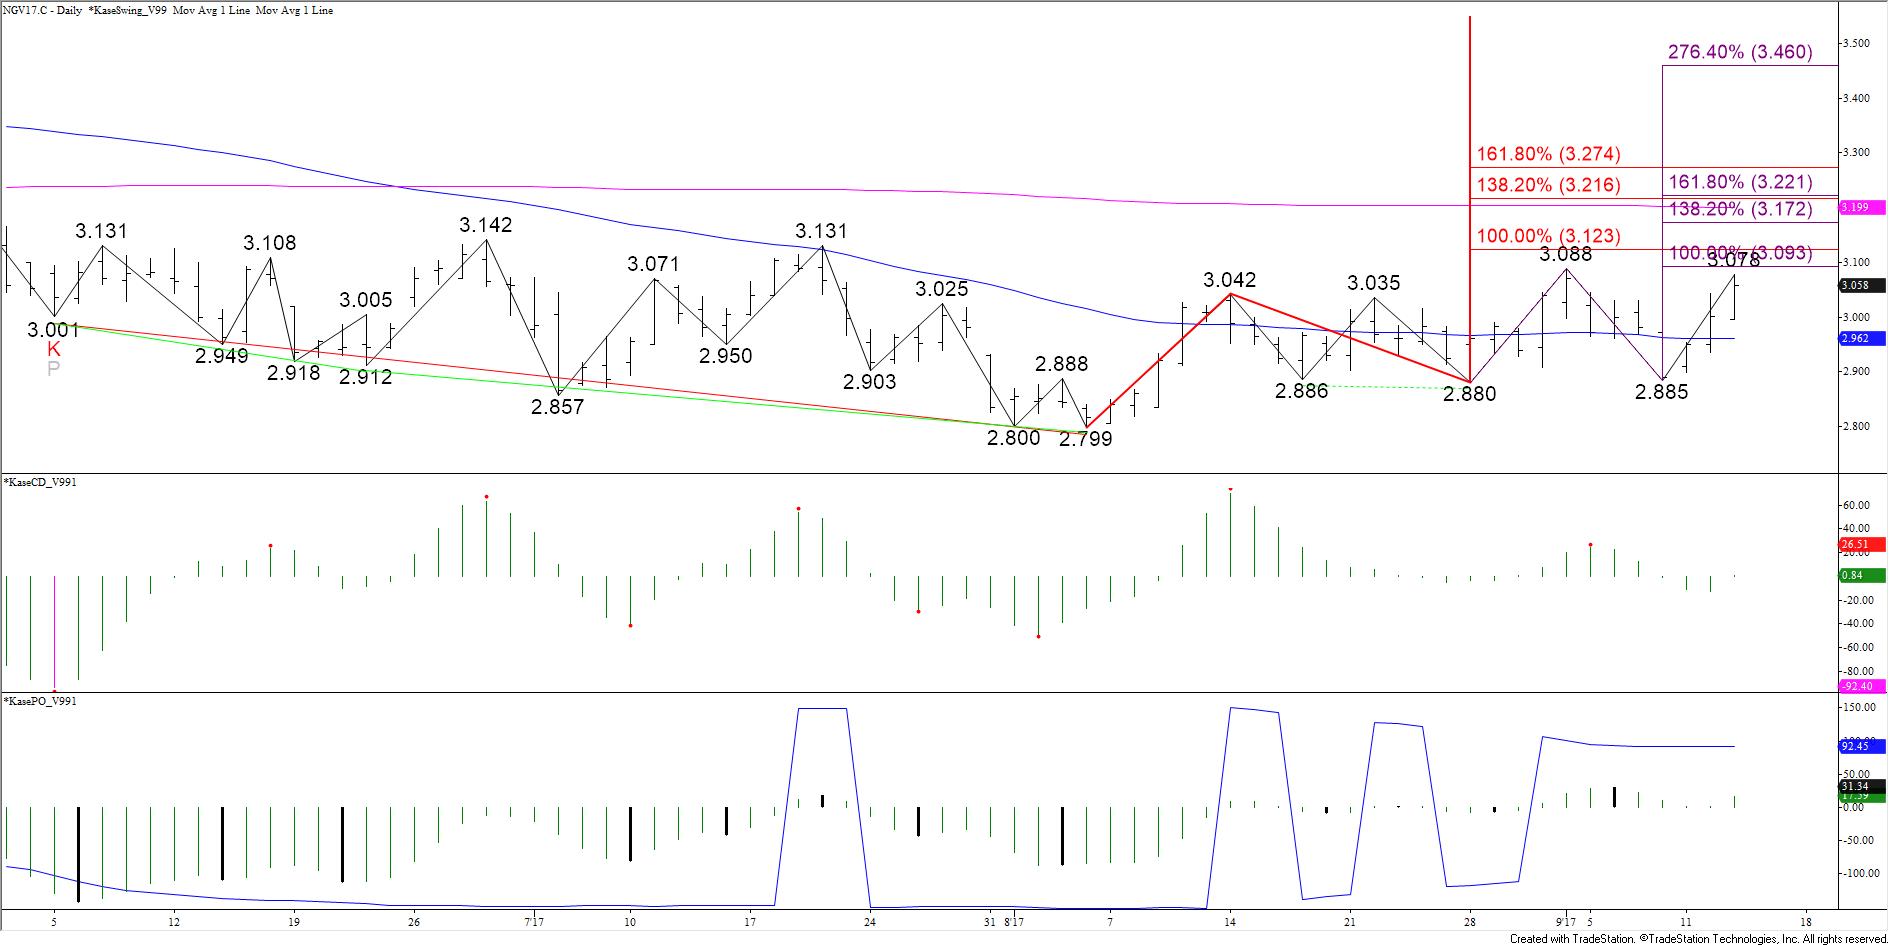
A sustained close above $3.12 would open the way for $3.17 and $3.22. Above $3.12 the $3.22 objective is most important because it is the 50 percent retracement of the decline from $3.619. This is also a confluent projection for the aforementioned waves up from $2.799 and $2.88.

Daily momentum does not show any signs that the move up will stall. However, a few intraday charts are setup for divergence or are overbought. Therefore, given $3.12 has been such strong resistance a pullback might take place before it is overcome.

At this point, any move down will most likely be corrective. Tomorrow, support at $3.03 should hold. Key support is $2.96, which is the 50-day moving average and 62 percent retracement of the move up from $2.88 so far.

This is a brief analysis for the next day or so. Our weekly Natural Gas Commentary and daily updates are much more detailed and thorough energy price forecasts that cover key natural gas futures contracts, calendar spreads, the UNG ETF, and several electricity contracts. If you are interested in learning more, please sign up for a complimentary four-week trial.

WTI crude oil still looks weaker than Brent and products after forming a star today and settling below Friday’s $48.28 midpoint. However, prices are poised to break higher out of a bullish ascending triangle and should meet the smaller than (0.618) target of the wave $47.0 – 48.44 – 47.84 at $48.7. A close above this would clear the way for the equal to (1.00) target at $49.3. This is an important objective because it is also in line with the smaller than target of the wave $45.58 – 49.42 – 47.0.

October 2017 WTI Crude Oil Kase Bar Chart

There is an outside chance the formation that makes up the ascending wedge is alternatively a double top at $48.44. To confirm the pattern prices would have to hold $48.44 and settle below the $47.84 swing low. This would then call for a test of the double top’s $47.2 target. Settling below $47.2 would call for the decline to extend to $46.8 and $46.4. The $46.4 level is most important because it is the smaller than target of the larger scale wave $50.51 – 45.58 – 49.42.

This is a brief analysis for the next day or so. Our weekly Crude Oil Commentary and daily updates are much more detailed and thorough energy price forecasts that cover WTI, Brent, RBOB Gasoline, Diesel, and spreads. If you are interested in learning more, please sign up for a complimentary four-week trial.

Yesterday’s decline was a dose of reality that has set natural gas back into a state of uncertainty. With all factors considered, October natural gas will most likely settle back into a neutral trading range between nominally $2.91 and $3.04. This is about the same range prices oscillated within before last Thursday’s break high out of the bullish flag.

Natural Gas Kase Bar Chart

The wave formation down from $3.088 and a bearish daily KaseCD divergence call for $2.95, which then connects to $2.91. A close below $2.91 would call for $2.85, which in turn, would take out the crucial $2.88 swing low. A move below $2.88 would wipe out the wave up from $2.799 that projects to key upper resistance at $3.12.

That said, the 50-day moving average has held, so there is a modest chance the wave up from today’s $2.96 low could extend to $3.04 first. At this point we expect $3.04 to hold. However, a close above this would call for another attempt at $3.09 and possibly $3.12.

This is a brief analysis for the next day or so. Our weekly Natural Gas Commentary and daily updates are much more detailed and thorough energy price forecasts that cover key natural gas futures contracts, calendar spreads, the UNG ETF, and several electricity contracts. If you are interested in learning more, please sign up for a complimentary four-week trial.

October WTI crude oil could not settle above $49.2 resistance and is exhibiting signs of exhaustion. A pullback should take place soon, but at this point, there are no definitive technical factors that indicate the move up will stall before reaching $49.6 and possibly $50.0. A close over $50.0 would open the way for another test of $50.5, which then connects to $51.1 and higher.

Crude Oil Daily Candlesticks

Initial support is $48.6. A close below this would call for a larger downward correction to $48.0 and $47.4. Support at $48.0 is the 100-day moving average and the 38 percent retracement of the move up from $45.58. A normal correction should hold $48.0. Support at $47.4 is in line with the 50-day moving average and the 62 percent retracement of the move up from $45.58. Settling below $47.4 would be a strong indication the move up is over.

This is a brief analysis for the next day or so. Our weekly Crude Oil Commentary and daily updates are much more detailed and thorough energy price forecasts that cover WTI, Brent, RBOB Gasoline, Diesel, and spreads. If you are interested in learning more, please sign up for a complimentary four-week trial.

October WTI crude oil continues to work its way toward crucial support at $45.6. Most importantly, this is the 62 percent retracement of the move up from $42.52 to $50.51. It is also a confluent projection for the waves down from $48.91, $48.5, and $48.2. A move below initial support at $46.1 will clear the way for $45.6.

CLV17 Daily Chart
CLV17 Daily Chart

The confluence of projections at $45.6 makes it a potential stalling point. However, today’s $46.44 settle was below the $46.5 smaller than (0.618) target of the larger scale wave $50.51 – 46.62 – 48.91. Therefore, this wave should ultimately extend to its $45.0 equal to (1.00) target. An upward correction will likely take place once $45.6 is met, but while the $48.91 swing low holds, odds will favor an eventual decline to $45.0.

That said, unstable external factors have crude and products on edge. Therefore, the move up from $45.76 this afternoon was likely short covering. Resistance at $46.9 should hold tomorrow. A move above this would call for a test of Monday’s $47.2 midpoint. Even so, unless WTI settles above $47.8, which splits the difference between Monday’s open and the 62 percent retracement of the decline from $48.91, the near-term outlook will remain negative.

This is a brief analysis for the next day or so. Our weekly Crude Oil Commentary and daily updates are much more detailed and thorough energy price forecasts that cover WTI, Brent, RBOB Gasoline, Diesel, and spreads. If you are interested in learning more, please sign up for a complimentary four-week trial.

WTI crude oil fell sharply last Thursday after OPEC and other major producers announced an extension to production cuts through March 2018. This was expected by most, and according to media, the decline was due to disappointment that production cuts were not deeper, which many had hoped for.

U.S. shale production remains a concern, though stockpiles fell for a seventh straight week, a fact that many have seemed to overlook. In addition, some are reportedly wondering what OPEC’s plan for an exit strategy to the production cuts will be without flooding the market with supply again.

For now, the extension of the OPEC cuts has become a game of “wait-and-see”. They will undoubtedly have a longer-term impact on prices, but at this point, it is hard to tell how significant the impact will be.

Most technical factors are negative, though it is still a tight call. July WTI made up some ground since falling late last week. However, the formation of a head and shoulders pattern is negative for the near-term outlook. The pattern’s neckline is $48.1, a close below which would open the way for the move down to continue toward its $44.65 target.

July 2017 WTI Crude Oil - 35-Cent Kase Bar Chart
July 2017 WTI Crude Oil – 35-Cent Kase Bar Chart

The connection to $48.1 is made through $49.1 and $48.6, the 0.618 and 1.00 projections of the wave $50.28 – 49.03 – 49.83. Tomorrow, we expect prices to test $49.1 and $48.6. A close below the lower objective would call for $48.1, the 1.382 projection, which is also near the 0.618 projection of the larger wave, $52.0 – 48.18 – 50.28.

That said, should prices rise above $50.3, near-term odds would shift in favor of $51.1 and possibly higher. The $50.3 level is the top of the head and shoulder’s right shoulder and the 0.618 projection of the wave $48.18 – 50.28 – 49.03. The 1.00 projection is $51.1. Therefore, a close above $50.3 would significantly damage the head and shoulders formation and the likelihood of a break below its $48.1 neckline.

This is a brief analysis and outlook for the next day or so. Our weekly Crude Oil Commentary and daily updates are much more detailed and thorough energy price forecasts that cover WTI, Brent, RBOB Gasoline, Diesel, and spreads. If you are interested in learning more, please sign up for a complimentary four-week trial.

WTI crude oil continues to rise ahead of May 25’s OPEC meeting. Market participants are optimistic that OPEC will extend production cuts through the end of 2017. Many hope this will help to ease the global supply glut. U.S. production remains a concern, but for now, oil prices are poised to rise.

Most technical factors are positive. In recent days, July WTI sustained settles above the 62 percent retracement of the decline from $54.45 to $44.13. This is a strong indication that the recovery from $44.13 will continue.

July 2017 WTI Crude Oil - 35-Cent Kase Bar Chart
July 2017 WTI – 35-Cent Kase Bar Chart

Today’s break higher out of another intraday bullish flag and settle above Monday’s $51.43 high opens the way for $52.5. As shown in the chart above, this is a highly confluent wave projection that sits just above the 78 percent retracement of the decline from $54.45 to $44.13. The confluence of wave projections at $52.5 make it a potential stalling point.

Momentum on the KaseCD and KasePO is rising. The KasePO is setup for bearish momentum divergence, a reversal signal that forms when higher swing highs in price and lower swing highs in momentum are made. To confirm the divergence signal, a swing high in price and momentum must form before momentum rises to a new high.

The Kase Easy Entry System (KEES) also triggered a second class buy signal (light blue L) on the 35-cent Kase Bar chart today. A second-class buy signal indicates the majority of momentum indicators KEES examines are positive but that momentum on the synthetic longer bar length is negative. Traders using Kase StatWare may have taken a smaller position and placed a tighter trailing stop. Stops may be widened once the KEES permissions shift to first class (dark blue dots).

For the near-term, the $50.57 swing low is important support. A move below this would likely trigger the bearish KasePO divergence and open the way for a correction to $50.0 and possibly $49.6.

This is a brief analysis and outlook for the next day or so. Our weekly Crude Oil Commentary and daily updates are much more detailed and thorough energy price forecasts that cover WTI, Brent, RBOB Gasoline, Diesel, and spreads. If you are interested in learning more, please sign up for a complimentary four-week trial.

Last Wednesday, June WTI broke higher out of the intraday bullish flag discussed in the crude oil forecast. The subsequent move up overcame the 0.618 and 1.00 projections of the wave $43.76 – 46.98 – 45.53. However, June stalled at $49.66 before meeting key resistance at $50.1. This is the confluence point between the 1.382 projection and the 62 percent retracement of the decline from $54.14 to $43.76.

Ultimately, June WTI should challenge $50.1. A sustained close over this would be a strong indication the larger scale move down is over, for now. However, bearish KaseCD and MACD divergences on the $0.50 Kase Bar chart call for a test of support first.

June WTI Crude Oil - $0.50 Kase Bar Chart
June WTI Crude Oil – $0.50 Kase Bar Chart

So far, the decline from $49.66 has been reasonably shallow and choppy, indicating it is most likely corrective of the move up. Today, June settled below the 0.618 projection of the wave $49.66 – 48.73 – 49.38 and met the 1.00 projection at $48.5. Meeting the 1.00 projection means the correction may already be complete. However, until prices rise above the $49.38 swing high, odds favor a deeper correction to $48.1 and possibly $47.1.

If the move up is going to continue to $50.1 this week, $47.1 must hold. This is the 62 percent retracement of the move up from $45.53 to $49.66. A close below $47.1 would call for a deeper test of support and possibly for June to challenge the crucial $45.53 swing low.

This is a brief analysis and outlook for the next day or so. Our weekly Crude Oil Commentary and daily updates are much more detailed and thorough energy price forecasts that cover WTI, Brent, RBOB Gasoline, Diesel, and spreads. If you are interested in learning more, please sign up for a complimentary four-week trial.

The long-term outlook for WTI crude oil remains negative and it is too soon to state that a bottom has been made. However, last Friday, June WTI met major support at $43.76, the 1.00 projection of the wave $57.95 – 47.58 – 54.14 (exact projection was $43.77). This was also in the realm of the August 2016 swing low of $44.56 and the 62 percent retracement of the move up from $36.18 to $57.95 ($44.5). The confluence of support between $43.77 and $44.56 and the fact that this range has held on a closing basis favors a larger upward correction before the decline continues.

In addition to meeting support at $43.76, June WTI confirmed daily bullish divergences on the KaseCD and Stochastic and a bullish KasePO PeakOut (oversold signal). These signals call for the upward correction to extend. Most importantly, over the past two days, the pullback from $46.98 formed a bullish intraday flag, shown below on the $0.35 Kase Bar chart.

June 2017 WTI Crude Oil - $0.35 Kase Bar Chart
June 2017 WTI Crude Oil – $0.35 Kase Bar Chart

For now, according to Kase’s price forecasting model, odds are 65 percent for a break higher out of the flag. These odds will increase as prices rise toward the upper trendline of the flag at $46.6.

Important resistance at $47.6 should be challenged upon a break higher out of the flag. This is the confluence point between the 38 percent retracement of the decline from $54.14 to $43.76 and the 0.618 projection of the wave $43.76 – 46.98 – 45.53.

That said, there are some danger signs that indicate the flag, and other bullish technical factors, are on the teetering edge of failing.

The key to a break higher out of the flag and extended upward correction is holding support at $45.5. This is in line with the today’s $45.53 swing low and the flag’s lower trendline. A close below this would call for a test of $45.0, the 62 percent retracement of the move up from $43.76 to $46.98. Settling below $45.0 would shift near-term odds back in favor of testing the $43.76 low again.

This is a brief analysis and outlook for the next day or so. Our weekly Crude Oil Commentary and intra-week updates are much more detailed and thorough energy price forecasts that cover WTI, Brent, RBOB Gasoline, Diesel, and spreads. If you are interested in learning more, please sign up for a complimentary four-week trial.

On Friday, WTI crude oil prices pulled back sharply after the U.S. Federal Reserve signaled short-term interest rates may be raised in coming weeks. The U.S. dollar rose, and oil prices fell. The week ended on a negative note, and the corrective pullback extended again on Monday.

Aside from the stronger dollar, media outlets also indicate traders and analysts are weighing the potential consequences of a still oversupplied market against the prospects of a production freeze. Last week, DOE data showed U.S. inventories of oil and refined products have risen to a record high. However, Iran has reportedly shown interest in joining talks with other major producers regarding measures to freeze production in a unified effort to stabilize prices.

The longer-term technical outlook for oil remains positive. However, near-term factors indicate the corrective decline should continue to extend first. October WTI met the 0.618 projection of the wave $49.36 – 46.42 – 48.46 on Monday. Nearly 80 percent of waves that meet the 0.618 projection extend to the 1.00 projection. Therefore, odds favor $45.5 before the move up continues.

CLV6 20160829

The $45.5 target is important because it is near the 38 percent retracement of the move up from $39.96 to $49.36. A “normal” correction should hold $45.5. A close below $45.5 would open the way for an extended correction and potential trading range in the mid-to-upper $40s.

The move down will remain choppy, but over the next few days look for resistance at $47.9 to hold. Key resistance is $48.7. A move to $48.7 would take out the wave down from $49.36 that projects to $45.5 and lower.

This is a brief analysis and outlook for the next day or so. Our weekly Crude Oil Commentary and intraweek updates are a much more detailed and thorough energy price forecast. If you are interested in learning more, please sign up for a complimentary four-week trial.