By Dean Rogers
S&P 500 Index (SPX)
It has been a rough start for investors and the stock market so far this year. Falling oil prices and a weak economic outlook for China have soured the outlook for global markets and have indices across the world testing major support.
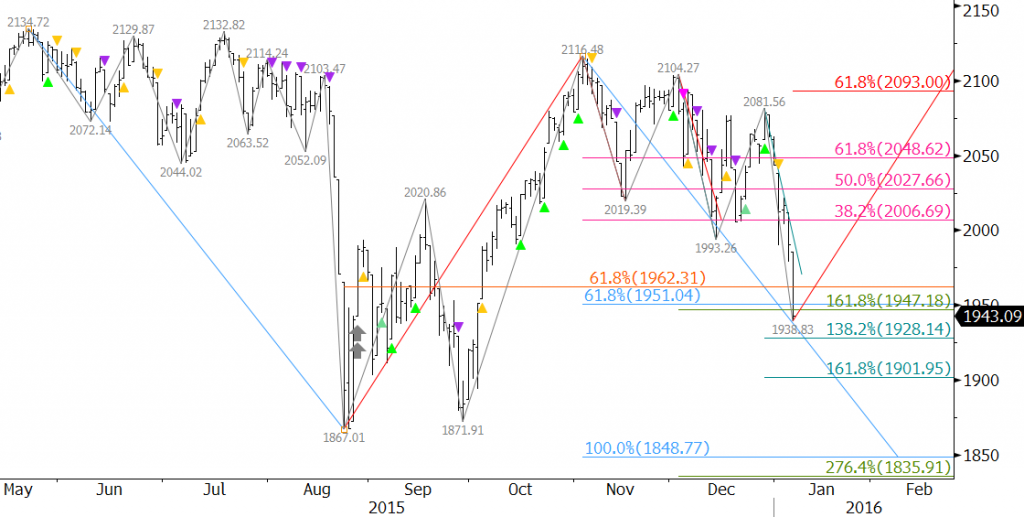
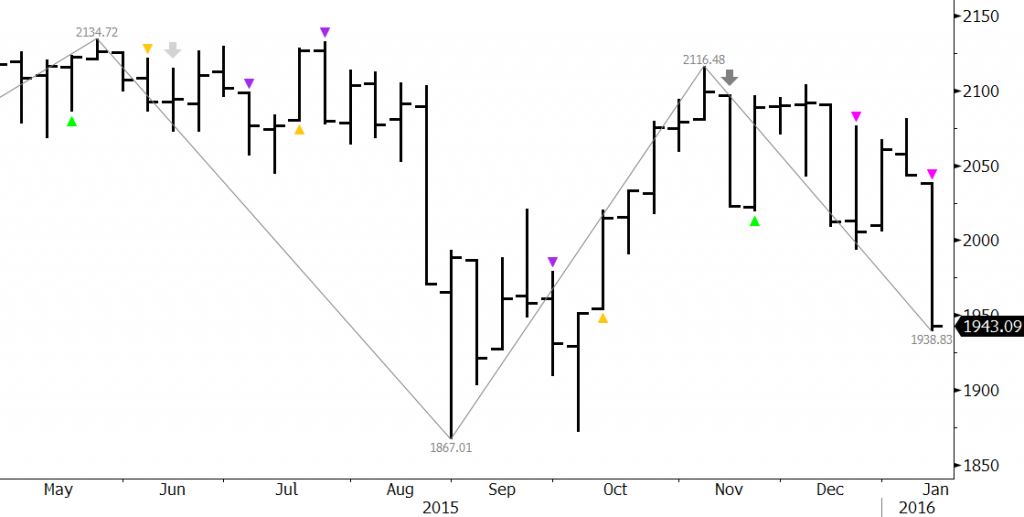
The technical outlook for the S&P 500 Index is negative. The index fell below its late August 2015 1867.01 swing low and has challenged major support at 1842 for the past few days. A few weeks ago we call for the S&P to test 1842 because of its confluence as a projection for major waves down from 2134.72 and 2116.48. This extremely important 1842 target was taken out by the 1812.29 swing low, but the index has not settled below 1842 yet.
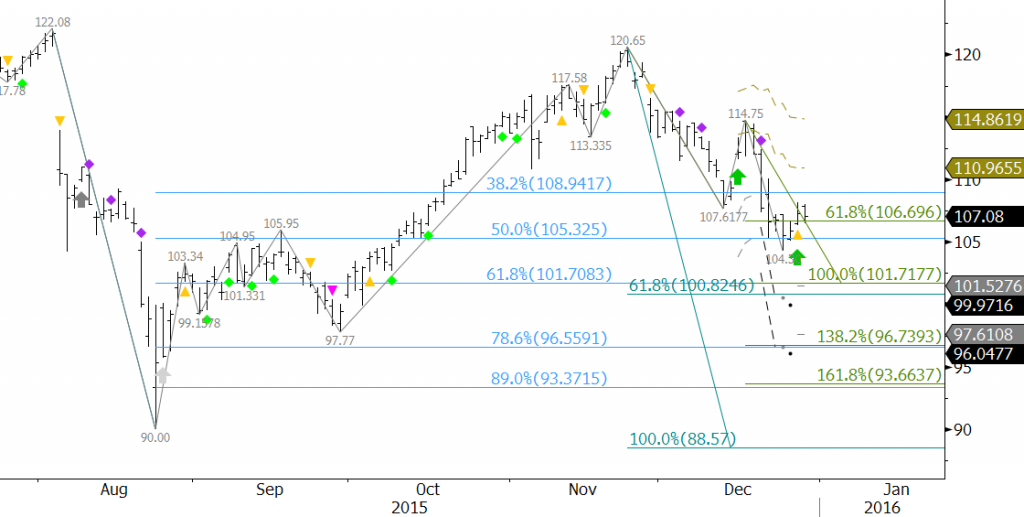
Daily S&P 500 Index with KaseX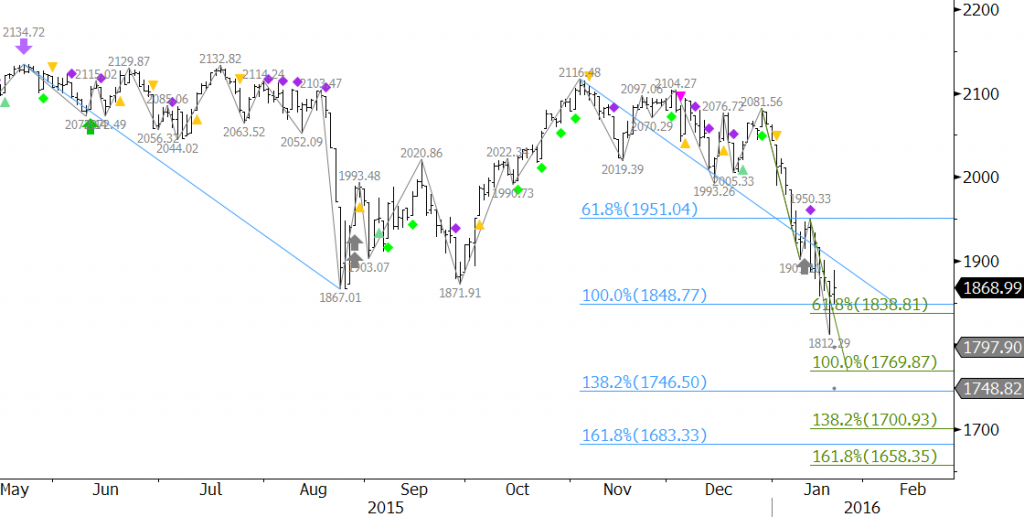
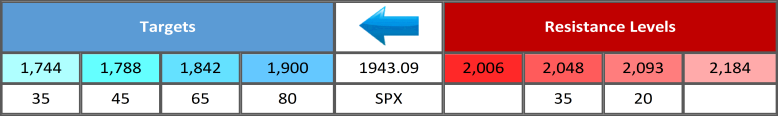
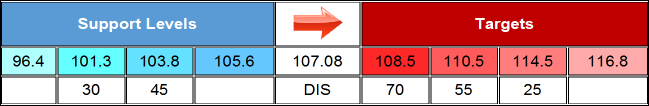
The 1842 target has been adjusted to 1845 based upon the new wave formations and retracements. A sustained close below 1845 could open the way for the decline to continue to at least 1771 and ultimately 1688 as indicated in the table below.
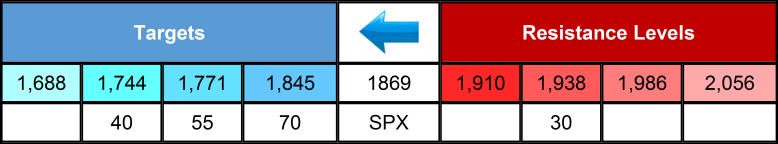
The confluence of 1842 makes it a potential stalling point, and at minimum, a correction will likely take place before the move down continues. Resistance at 1910 should hold, but the key level for the near-term is 1938. A close over 1938 would not mean that the move down is over, but would rather call for an extended upward correction to 1986 and possibly 2056. A close over the latter would be bullish for the long-term outlook.
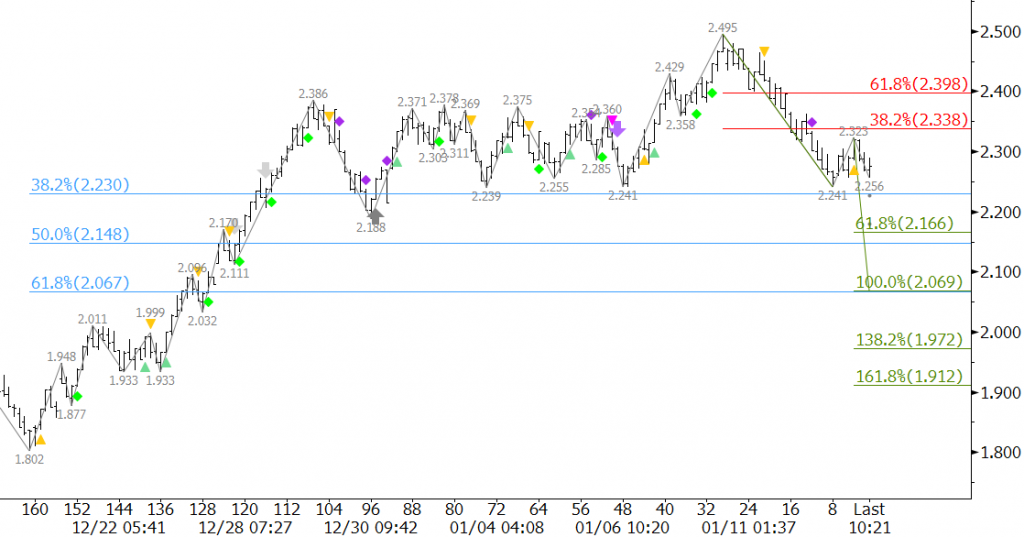
10-Year T-Note Futures (TY)
As stock prices have fallen some monetary funds have been shifting into fixed income. As a result, 10-Year T-Note futures have risen substantially in recent weeks. The move up is poised to continue, but several negative technical factors indicate a correction should take place first.
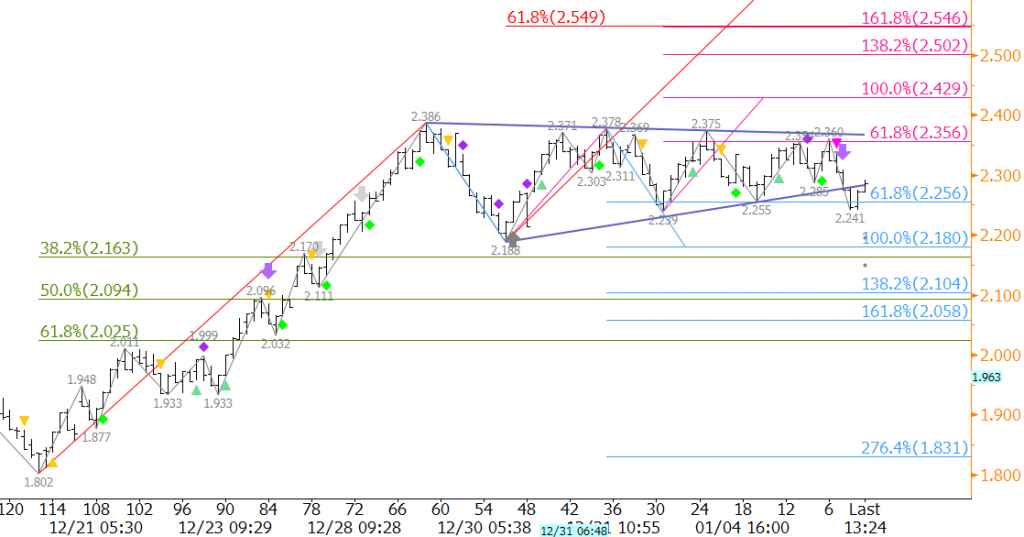
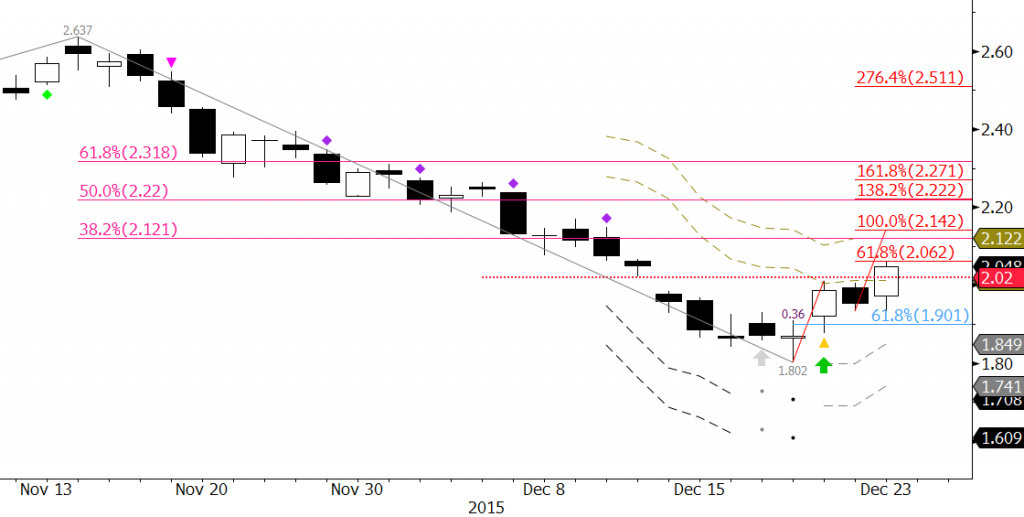
An important resistance level at 128’19 was overcome earlier this week. This was the 0.618 projection for the wave 124’19 – 130’00.5 – 124’14. Kase’s wave analysis studies show that once the 0.618 projection is met most waves will extend to at least the 1.00 projection, in this case 130’17. This is near our model’s confluence point of 130’0 and the most recent major swing high. A sustained close over 130’0 would call for 131’20 and very likely 132’16.
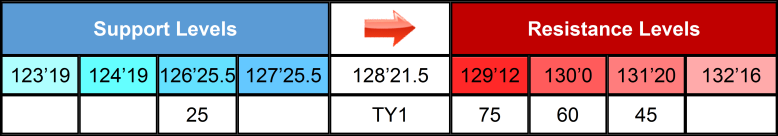
The retracements of the move up from 125’14 to 129’08 define crucial support levels in coming weeks. As stated, a correction is expected, and a normal correction should hold 127’25.5. A close below this would call for an extended correction to key support at 126’25.5. If the move up is going to have any chance at continuing in coming weeks 126’25.5 must hold.
Daily Continuation 10-Year T-Note Futures with KaseX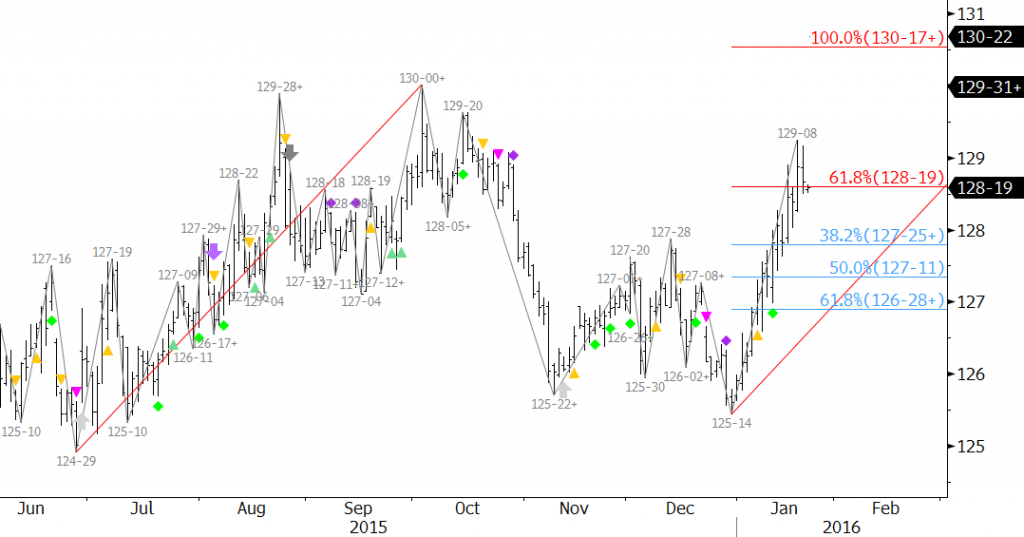
These are brief technical analyses based upon Kase’s technical forecasting models and trading indicators KaseX and Kase StatWare. If you are interested in taking a trial of KaseX or Kase StatWare please contact sales@kaseco.com. We would love to get your thoughts about the forecasted targets and probabilities. Leave a comment or send them along with your request for a trial to sales@kaseco.com.