WTI Crude Oil Technical Analysis and Short-Term Forecast
This is a brief analysis for the next day or so. Our weekly Crude Oil Forecast and daily updates are much more detailed and thorough energy price forecasts that cover WTI, Brent, RBOB Gasoline, Diesel, and spreads. If you are interested in learning more, please sign up for a complimentary four-week trial.
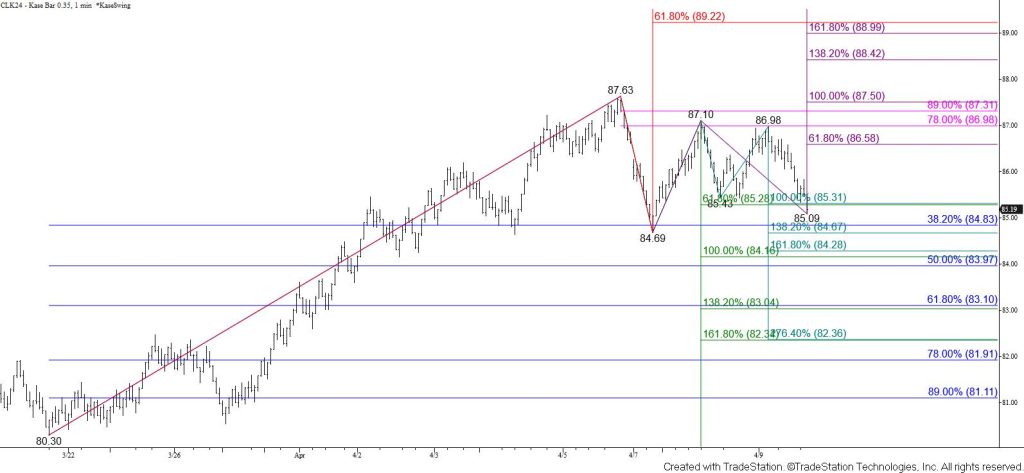
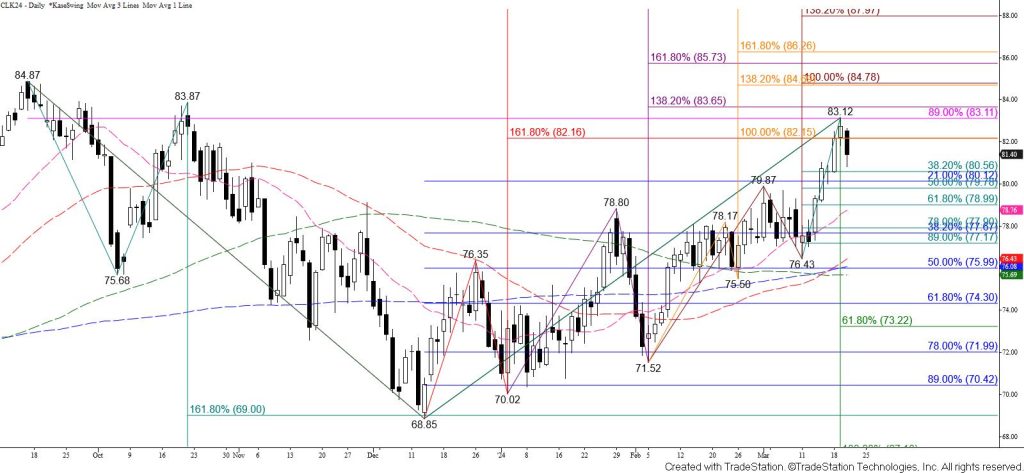
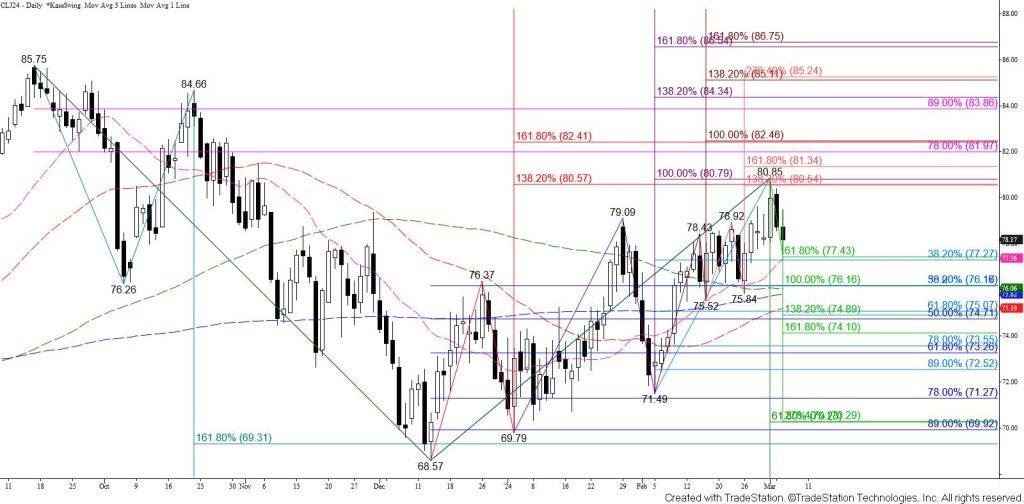
WTI crude oil’s uptrend is intact but has been due for a correction. Friday’s confirmed evening star, Monday’s long-legged doji, and daily bearish weak KaseCD and MACD divergences indicate a solid test of support should take place before the uptrend extends. Furthermore, Tuesday’s decline took out the smaller than (0.618) target of the wave down from $87.63 and the equal to (1.00) target of the wave down from $87.1. Therefore, the corrective move down is poised to test at least $84.7 and likely the $84.1 equal to target of the wave down from $87.63. Settling below $84.1, which is also the 50 percent retracement of the rise from $80.3, will call for an extended correction to challenge this wave’s $83.0 intermediate (1.382) and $82.3 larger than (1.618) targets in the coming days.
Taking out the $85.3 target has increased the odds for a deeper test of support. However, this is still a somewhat tight call for the near term because similar corrections in recent weeks have been short-lived. Should WTI crude oil turn higher and overcome the $86.6 smaller than target of the wave up from $84.69 the odds for a deeper test of support will be significantly dampened. In this scenario, look for a test of key near-term resistance at $87.5. Settling above $87.5 would confirm that the correction is complete and shift near-term odds in favor of rising to $88.4 and likely $89.1.