
by Cynthia Kase
Read on TraderPlanet.com
“Ask Kase” any question you may have about any actively traded security, and your question may be chosen as the subject of a future column (askkase@kaseco.com).
To an earlier generation the “Dorsey” brought to mind the famed orchestra leader and his acclaimed song, I’ll Never Smile Again. Followers of the tech market, though, will immediately think of Twitter’s interim CEO, Jack Dorsey. He’s just replaced Dick Costello, who, having been pressured by disgruntled investors, recently resigned.
Pundits point to reasons why Twitter’s been doing so poorly. Some blame mismanagement and complacency. Other tech-world doyens, compare Twitter’s user base, only about 20 percent of Facebook’s, and think there’s lots of untapped potential.
So the big question is – will Twitter ever “smile again”? Should one sell, buy, wait, or what?
Long positions became tenuous as sideways action in April followed a failure to overcome last October’s $55.99 high. When markets are dead-sideways, directional traders hold risk unrewarded. Any long positions should have been exited, if not on inactivity, then on stops, as, on the monthly chart, April completed an evening star pattern, with May confirming its demise.
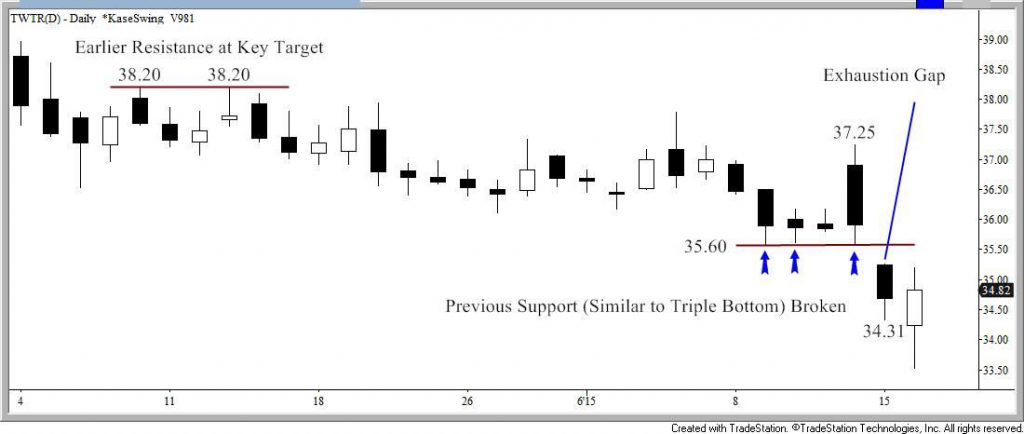
Bearish action accelerated with a down gap on Monday’s open and broke through a potential triple bottom around $35.6. Yet, the gap might be an exhaustion gap, and Tuesday traded about $1.70 up from its $33.51 low. Momentum indicators are set up for bullish divergence, which requires the low to hold and at least one up day to complete.
Tuesday’s low was the 0.62 projection of the key wave, $44.20 – 36.52 – 38.20, and is nearing a 38 percent decline from $53.49, and thus could form support. These are only glimmers of hope, but there’s no smiles as of yet.
Twitter Daily Candlestick Chart
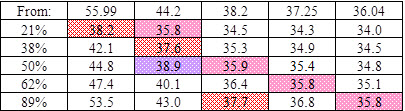
If you’re looking for a buy, I’d wait and watch for $36, $38.25, and $39 and get in on closes over, depending on how aggressive you are, or use all three, scaling in. These levels are just above Kase’s daily DevStops 2 and 6, and weekly warning line, respectively, with two latter May’s midpoint and open. Tuesday’s up wave, 33.51 – 35.20 – 34.61, targets $36 as the 1.0 Fibonacci extension and f3 corrective projection, and $39 as the trend terminus (35.203/33.512) and (2*1.38) extension. All three thresholds are important retracements, with $38.2 the critical 21 percent retracement of the entire move down from $55.99.
Retracement Table Down to $33.51
For the unsmiling, provided $35.6 holds on a closing basis, I’d sell into an intraday decline and hold tight stops until safely below $33.2, at which time scaling up to a higher intraday or daily chart would be okay. I’d continue to monitor risk very closely as there’s support at $32. Below that I’d hang short, watching action closely at confluent Fibonacci extensions of $30.8, $27.7 and $25.5, with the major downside target $23.8.