WTI Crude Oil Forecast
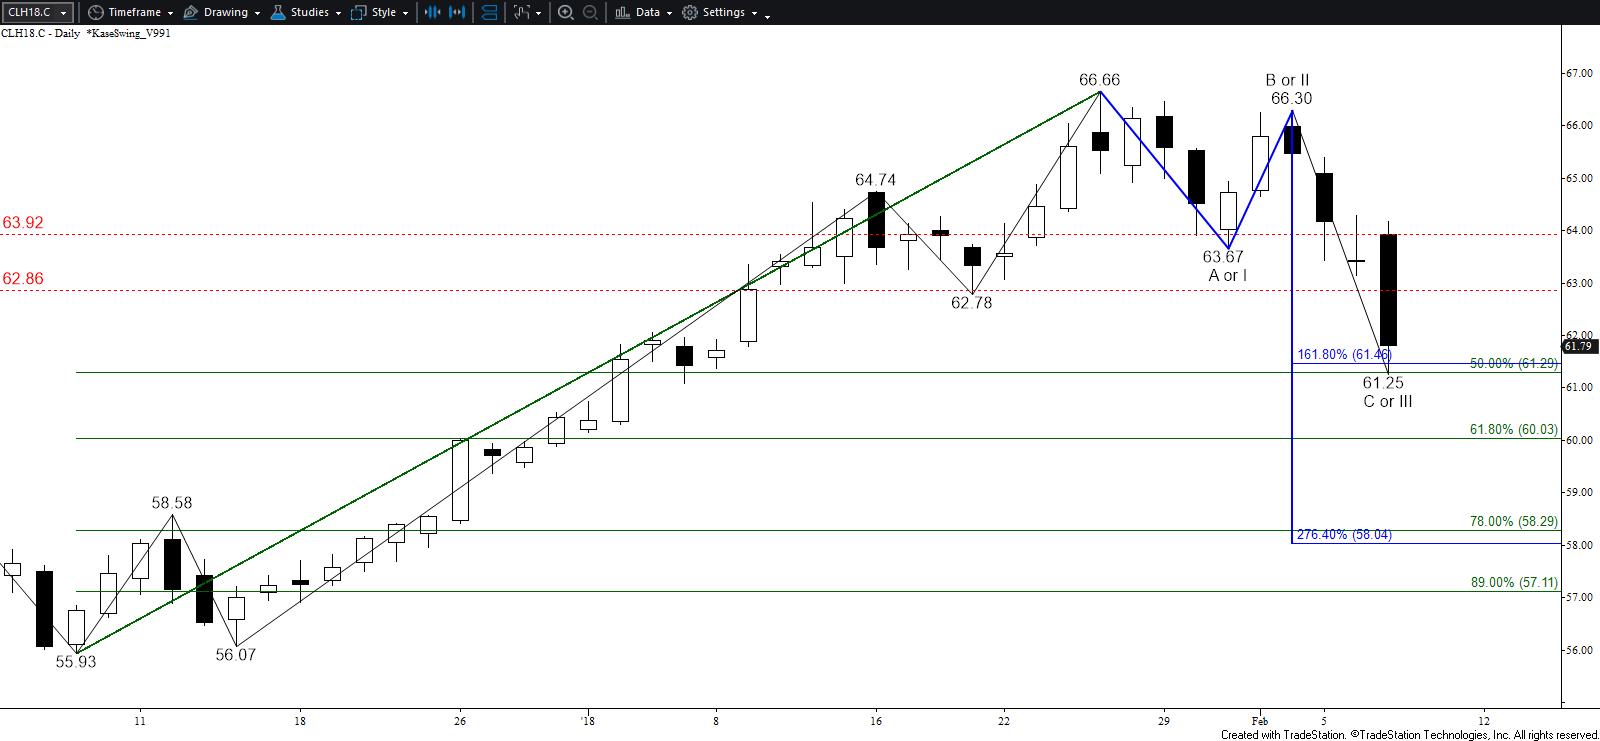
Late last week, June WTI crude oil broke higher out of a daily bullish flag. This week’s crude oil price forecast indicated there was still a crucial target at $70.1, but this objective was overcome with relative ease Monday. Today’s corrective pullback stalled at $67.63 before settling the day at $69.06. This was just above the upper trend line of the bullish daily flag, and this afternoon prices are already nearly $1.00 higher and have overcome the key 62 percent retracement of the decline from $70.84. Therefore, the outlook remains bullish and the move up is still poised to extend.
The wave formations up from $67.63 indicate WTI should challenge at least $70.6 and likely $71.1 tomorrow. This afternoon’s bullish sentiment (which is purportedly based on external factors) could also drive prices to $71.7 and even $72.8, especially if prices rise above $71.1 early.
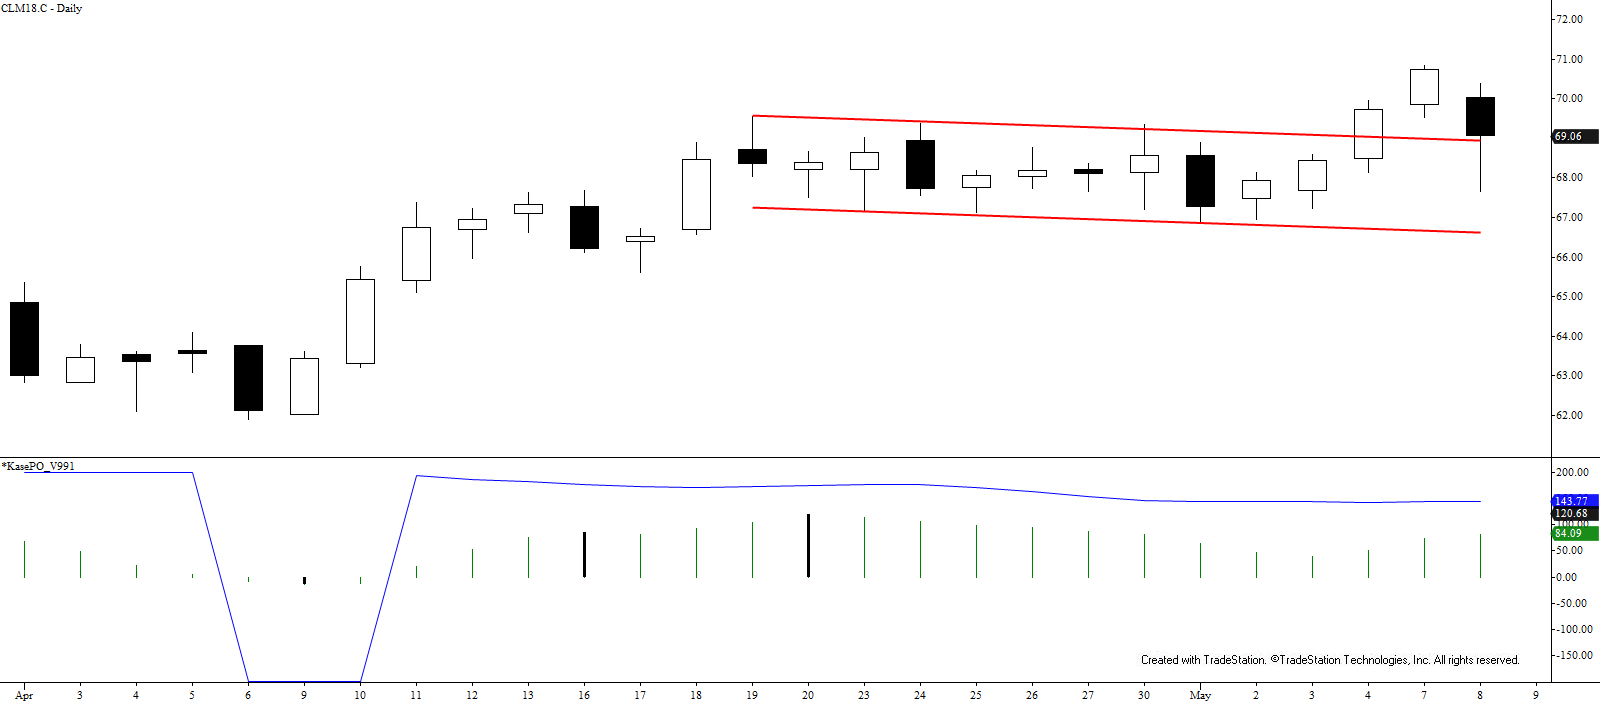
That said, when external factors and bullish sentiment are driving the market prices tend to become over exuberant and can overshoot reasonable objectives. While $71.1 and $72.8 make technical sense for the near-term, anything above $72.8 without a reasonable pullback first would warrant caution of a spike type scenario that could reverse very quickly.
For now, look for support at $68.6 to most likely hold with the key threshold at $67.9. A close below the latter would indicate the move up has failed and would open the way for a larger downward correction to $66.8 and lower.
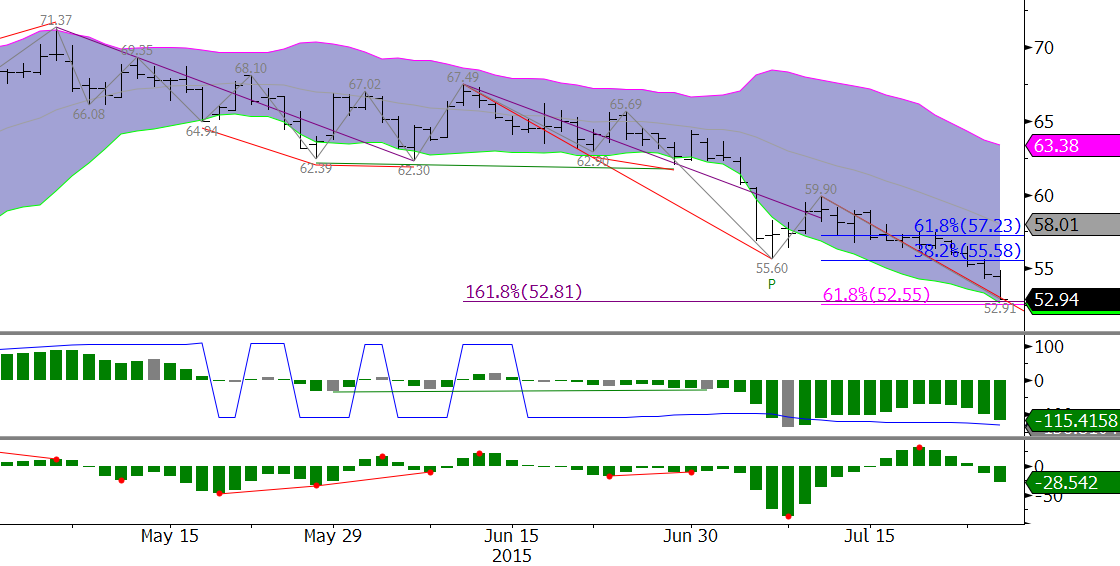
Brent Crude Oil Forecast
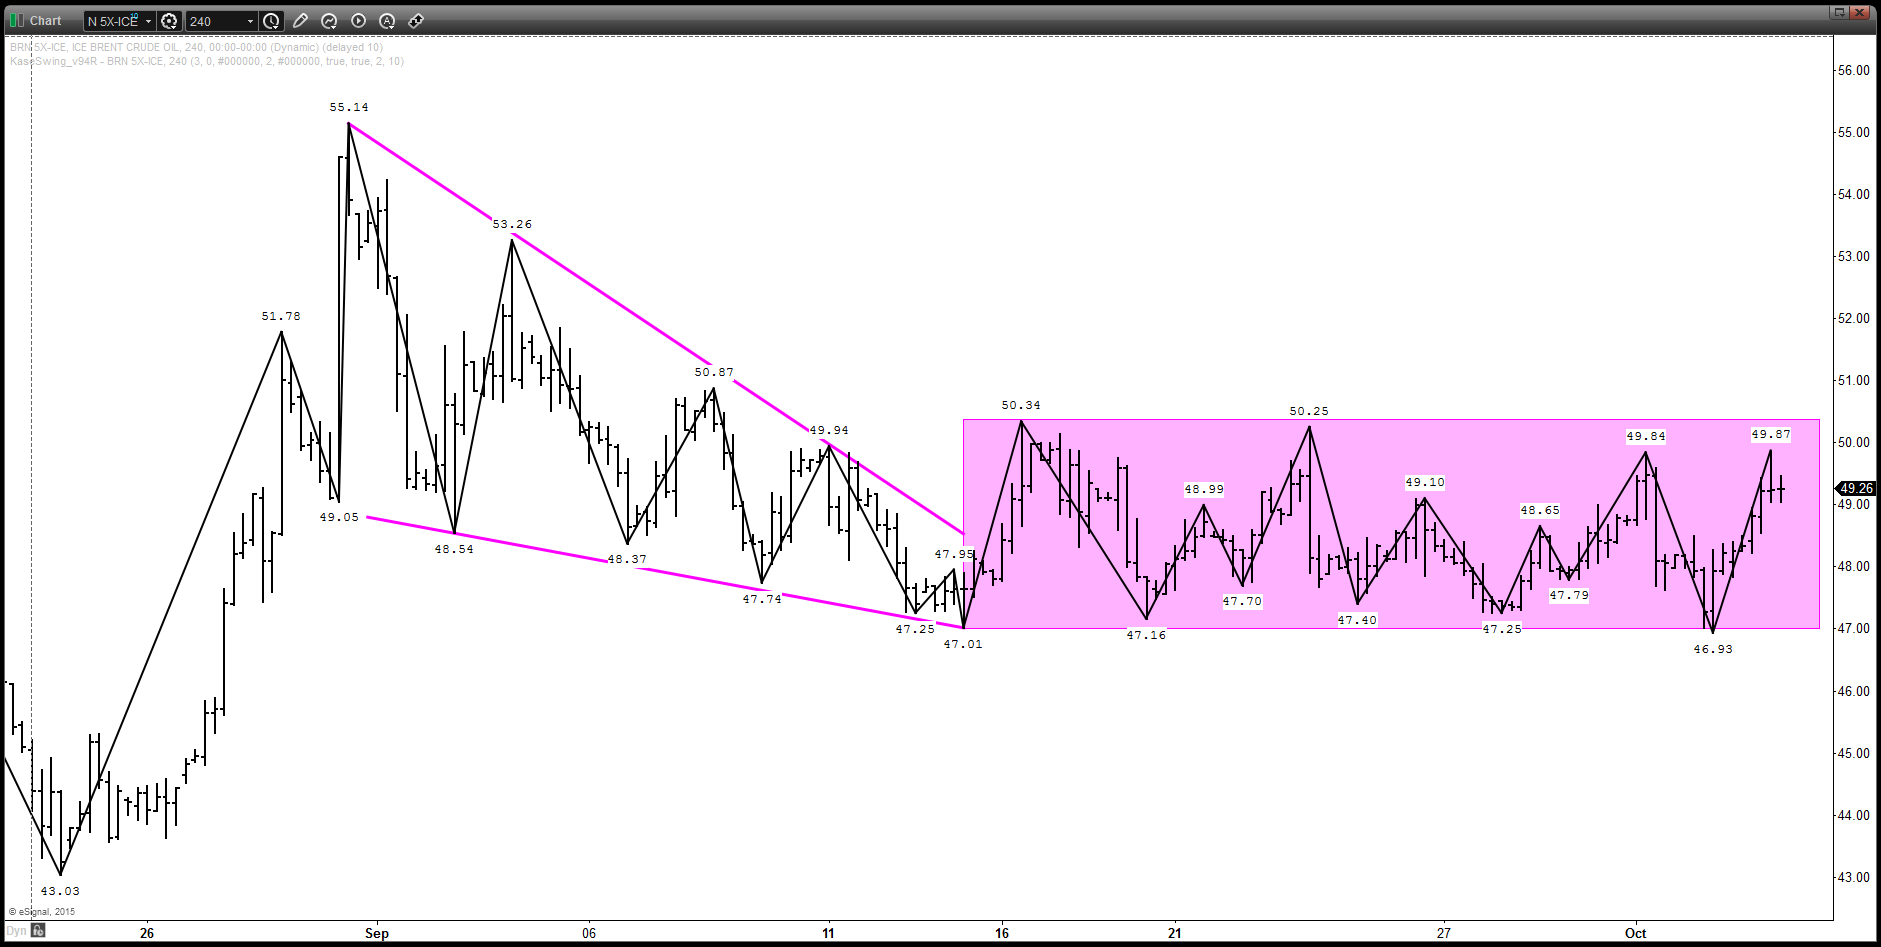
Although Brent formed a bearish daily hanging man, prices have risen over $1.00 this afternoon after settling at $74.85. The wave formation up from $73.1 is poised to reach at least $76.8 and likely $77.8 tomorrow. A close above the latter will open the way for $78.6 and $79.9.
That said, the bullish sentiment driving prices higher this afternoon (see WTI’s comments above) could push prices too high too fast, causing a spike type scenario that could quickly reverse. Therefore, caution is warranted on any move above $79.9 over the next few days without a reasonable pullback first.
For now, support at $74.2 should hold, though prices will have to drop below the $73.07 swing low to indicate the move up has failed. In this unlikely case, look for a larger downward correction to $71.7 and possibly $70.8.
This is a brief analysis for the next day or so. Our weekly Crude Oil Forecast and daily updates are much more detailed and thorough energy price forecasts that cover WTI, Brent, RBOB Gasoline, Diesel, and spreads. If you are interested in learning more, please sign up for a complimentary four-week trial.