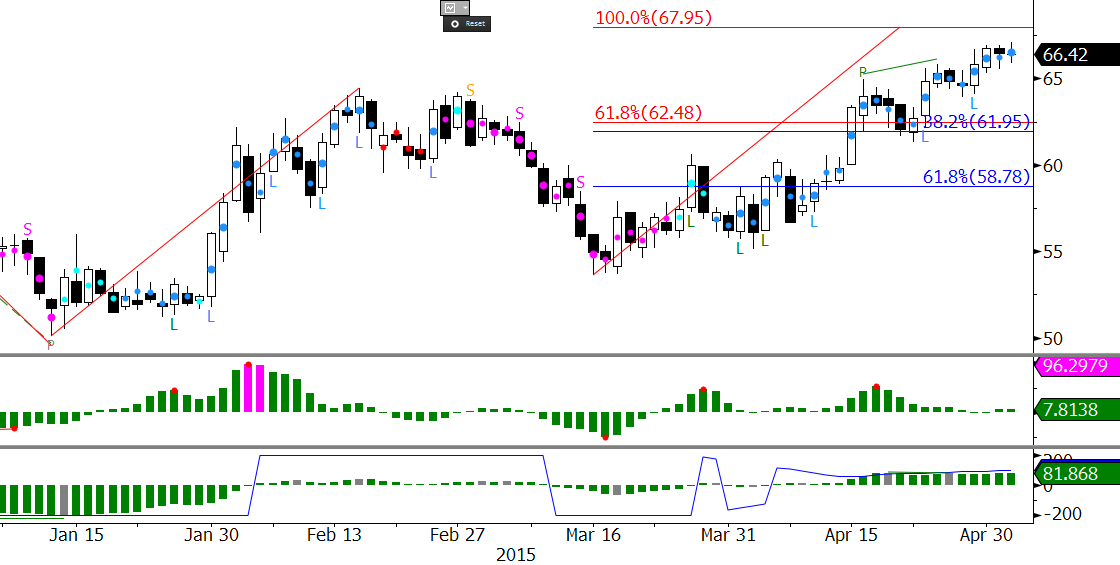
WTI-Brent Spread Narrowing

The WTI-Brent spread narrowed to ($5.81) on Monday and will likely continue to narrow over the next few days as it approaches a key threshold at ($4.40). This is the 62 percent retracement of the decline from $1.01 to ($13.13). The narrowing spread is currently a result of strengthening WTI prices and a weaker outlook for Brent. Ultimately, weaker Brent prices and a narrow spread could put another wave of downward pressure on both WTI and Brent. It will likely take at least a few more days, but look for the spread to stall near ($4.40).

Take a trial of Kase’s Weekly Crude Oil Price Forecasts.

WTI-Brent Spread

Brent crude’s failure to close above the $57.5 completion point of the weekly morning star setup (circled in green) was negative and indicates the geopolitically driven move up that took place last week may be short lived. The Brent crude price rose modestly on Monday, but most short-term technical factors indicate it should test $53.1 again. A close below this would call for $49.2, which is the last target protecting the $48.95 contract low.

Look for resistance at $57.5 and $60.05. A close over the latter would open the way for the $63.66 swing high to be challenged.

Take a trial of Kase’s weekly WTI and Brent Crude Oil Price Forecast.

Brent Crude Prices

Brent has been trading in a corrective range for the past several days, but fell to major support at $47.7 on Tuesday. This is the 0.618 projection for the wave $52.42 – 48.07 – 50.41. The $47.7 projection connects to a major target at $45.8 as the 1.00 projection. This is also the 1.618 projection for the largest and most important wave down from the $111.38 contract high. KaseX confirms the negative call with confirmed short signals (purple triangles) on the 120-minute equivalent Kase Bar chart.

For more information about KaseX please visit our trading indicators page. The learn about our forecasts please visit our energy forecasts page.

Brent

Coming into this week there was an outside chance that Brent would hold $67.0. However, prices settled below $67.0 on Monday. There is immediate support at $65.2 as discussed in this week’s Crude Oil Commentary, but the decline is now poised for at least $62.8 and likely $58.5 before a measurable retracement takes place. The key target is $58.5 because it is the most confluent wave projection and the equal to (1.00) target for the wave $112.59 – 83.41 – 88.42. A sustained close below this will open the way for $53.8 and $48.7.

There is very little evidence that the move down is going to end at this time. Prices are still deeply oversold and overdue for a correction, but until at least initial resistance at $70.5 is overcome, the move down is favored. Next resistance is $72.1, and a close over the this would call for and an extended correction to $75.1 and possibly $79.8.

For detailed weekly forecasts take a trial of our energy commentaries.

brent


The WTI-Brent spread narrowed last week, but the move looks corrective. The spread will likely oscillate for the near-term, but ultimately odds favor a widening spread. The first target is (5.00), and a close below this would call for (6.50) and (9.00). Key long-term support is (11.80). This is a confluent wave projection and the 62 percent retracement from (19.38) to (0.01). Resistance at (0.90) should hold. A sustained close over (0.90) would open the way for 1.30 and 2.90.

For more information and to take a trial of Kase’s weekly energy forecasts please visit the Energy Price Forecasts page.

WTI-Brent


This is the fourth of a four part series on Kase Wave Analysis. In this video Kase’s senior analyst, Dean Rogers, shows how the Kase Wave Analysis can be combined with other technical factors and indicators to make trading decisions.

http://youtu.be/3JcHjdr2QWM


The Kase Commentaries on Crude Oil and on Natural Gas provide highly accurate weekly near term market outlooks. Kase’s analysis has proven to be remarkably accurate in identifying critical market turning points and probable market behavior.nnThe Commentary is highly technical, but interactive, so readers can click on unique words and phrases for definition to help them better understand the analysis. This is a great stand-alone product, but also works well as a companion product for Kase StatWare, KaseX or any of Kase’s Hedging Models.nnKase offers a free trial period for the Commentary so contact us today!

http://youtu.be/f8QZuOqZF5g


Successful long term hedging requires logical decision-making. Hedgers need to understand the underlying structure of the market and longer-term behavior in order to find points that minimize the risk and maximize the results of a hedge plan. It is also important to find the best balance for your company between budget oriented goals and achieving better than market prices. The HedgeModel identifies these low risk points and can be custom tailored to whatever strategy is befitting your mixture of goals and risk tolerance.

The HedgeModel is statistically based and does not require any previous trading experience to use. It is more-or-less mechanical and requires only 15 to 20 minutes per day to operate. It is data driven, so it works on any historic data stream in energy, including natural gas, crude oil, refined products, petrochemicals and crack spreads.

The Natural Gas Hedge Report is a companion product to Kase’s HedgeModel that includes a forecast for the perpetual, three-, six- and twelve-month strips. It also includes recommendations on how to set hedging strategies for the forthcoming quarter, changes to the settings used by HedgeModel, low-risk hedge targets, recommendations on what instruments to use, a track record and mark to market of recommended strategies, and research results.

Kase also performs ongoing research into market behavior and structure. Our research is oriented toward improving the results of our clients’ hedging strategies. In addition to a thorough evaluation of basis and correlation analysis, standard research in our quarterly Hedge Reports includes Monte Carlo simulations for estimating price distributions and objectives, statistical analysis of price and volatility, and cyclical behavior.

http://youtu.be/P3aigMq7h0A