WTI Crude Oil Technical Analysis and Short-Term Forecast
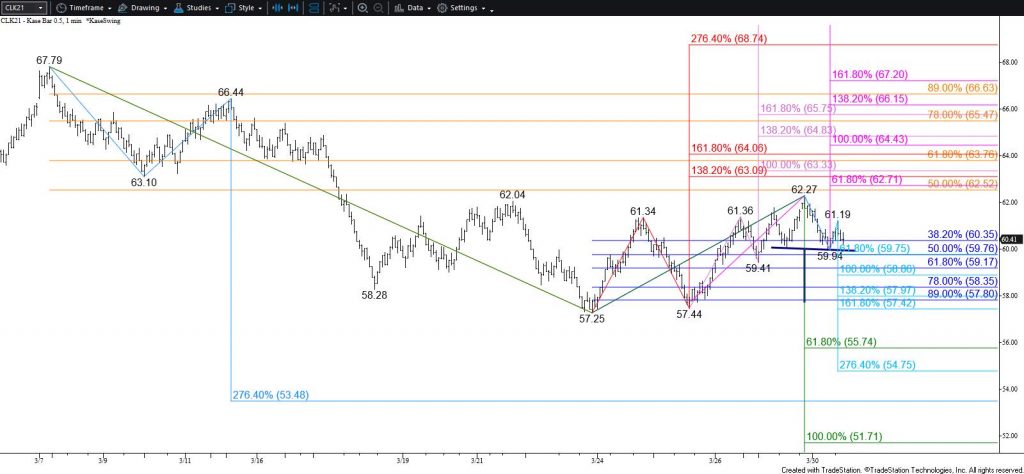
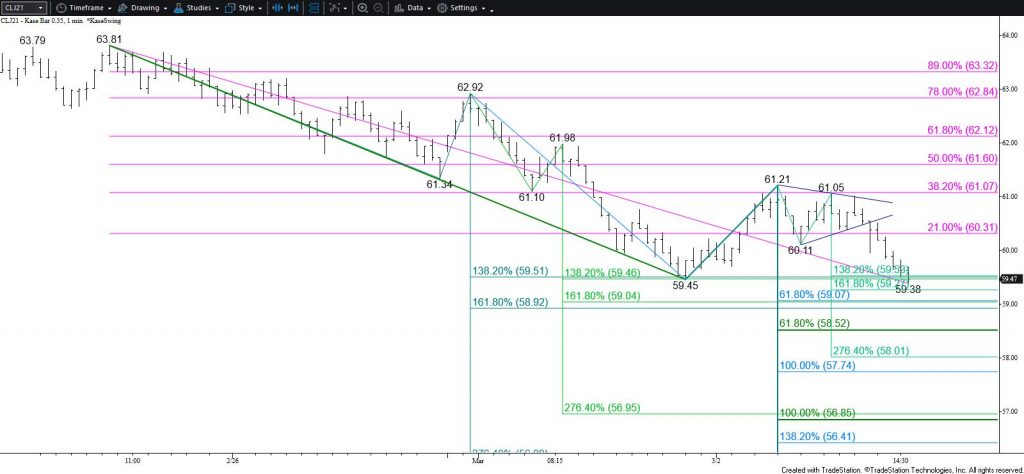
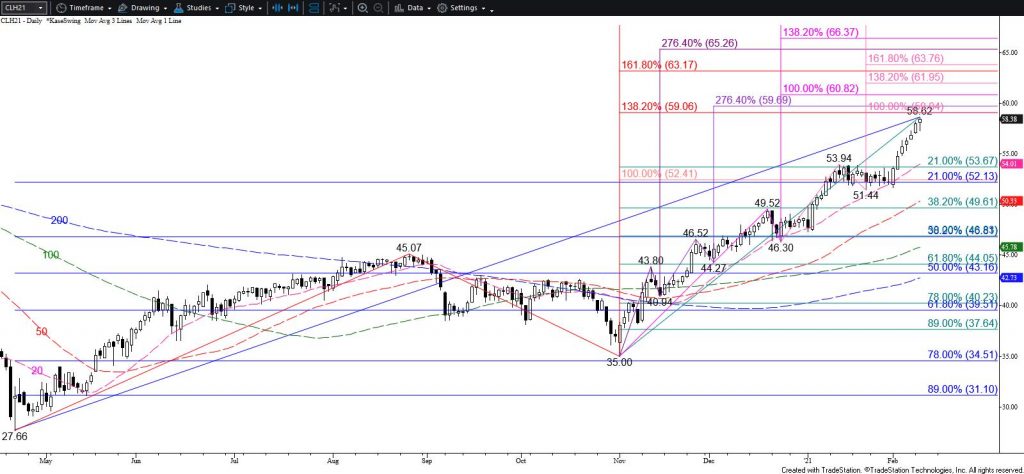
WTI crude oil continues to trade in an indecisive trading range. Today’s initial move up fulfilled the $60.7 smaller than (0.618) target of the primary wave up from $57.25. This was bullish, but the move stalled and the pullback from $60.9 suggests another test of support will probably take place tomorrow. This is a tight call, but near-term odds lean in favor of $58.4, a move below which will call for $57.2. Settling below $57.2 will cause a break lower out of the trading range and call for a test of a bearish decision point at $55.7 that connects to $51.7 and lower.
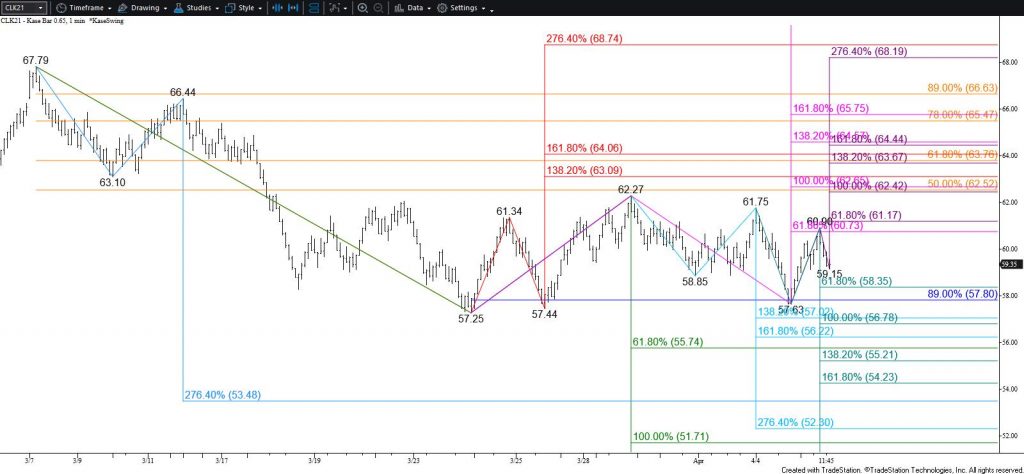
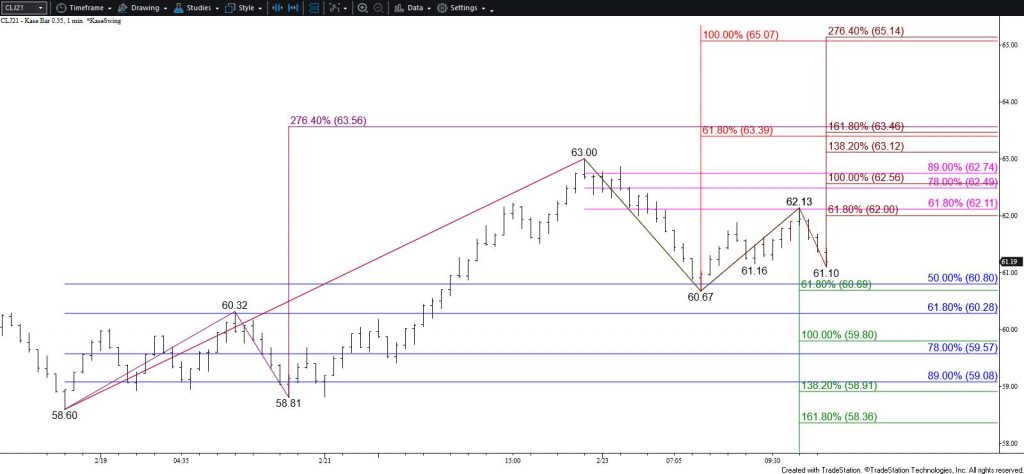
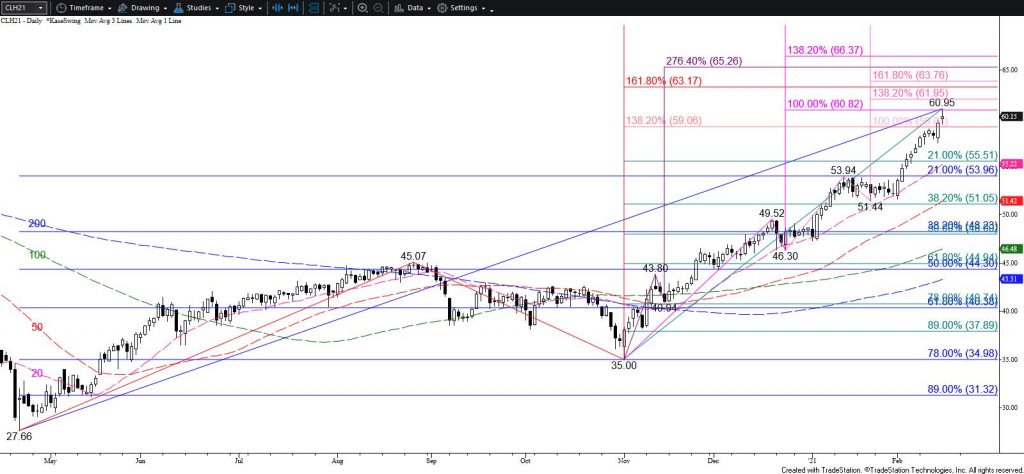
With that said, fulfilling the $60.7 smaller than target of the primary wave up from $57.25 implies that while the $57.63 swing low holds this wave still has good potential to extend to its $62.5 equal to (1.00) target. The connection to $62.5 is made through $61.2, the smaller than target of the wave up from $57.63. Closing above $62.5 would shift near-term odds in favor of testing the $63.8 bullish decision point. Closing above this would strongly suggest that the corrective move down is complete and clear the way for the uptrend to extend to new highs in the coming weeks.
The primary takeaway is not the direction of the call but rather the implications of either a close below $61.2 or above $62.5. Everything else that happens between those levels will likely be noise. Closing beyond either threshold would then call for a test of the longer-term bearish or bullish decision points at $55.7 or $63.8, respectively.
This is a brief analysis for the next day or so. Our weekly Crude Oil Forecast and daily updates are much more detailed and thorough energy price forecasts that cover WTI, Brent, RBOB Gasoline, Diesel, and spreads. If you are interested in learning more, please sign up for a complimentary four-week trial.