Walt Disney Co. (DIS)
By Dean Rogers
“Well, the Force is what gives a Jedi his power. It’s an energy field created by all living things. It surrounds us and penetrates us; it binds the galaxy together.” You may think that I am referring to the legendary words spoken by Obi-Wan Kenobi to Luke Skywalker while teaching him the ways of the Jedi in “Star Wars” (later retitled “Star Wars Episode IV: A New Hope”). However, I refer to that quote because Walt Disney Co. has made the essence of Obi-Wan Kenobi’s statement about the Force the mantra of their capitalization on the Star Wars brand after acquiring Lucasfilm in 2012 for $4.06 billion.
For the past several months, and likely for the next several years, everywhere you look Star Wars branded items from toys, to clothing, to cars, and even makeup, surround us, penetrate us, and binds Disney’s marketing efforts together. I call it the “Essence of the Force Strategy”.
So far, Walt Disney Co.’s strategy has worked, and it has worked well. “Star Wars Episode VII: The Force Awakens” has already shattered world-wide box office records and has brought in over $1 billion since its opening in the U.S., and some think that it will bring in $1-2 billion more after its opening in China on January 9. Those figures will not even scratch the surface of what is to come from the Star Wars brand for Walt Disney Co. in merchandise sales, Episodes VIII and IX, and the expansion movies like “Star Wars: Rogue One” slated for release in December 2016. The key question is, will Star Wars be enough of a boon to support DIS and turn the stock price higher in coming weeks, months, and even years?
There is a lot more to Walt Disney Co. than Star Wars. They have made brilliant moves in recent years with their acquisition of Lucasfilm, Marvel Studios, Pixar, and The Muppets to name a few. However, there are other areas of Walt Disney Co., such as the rising sports right costs of ESPN, that weigh heavy in the minds of some Wall Street pundits. Enough so, that some are doubting the prospects of a long-term move higher for DIS shares.
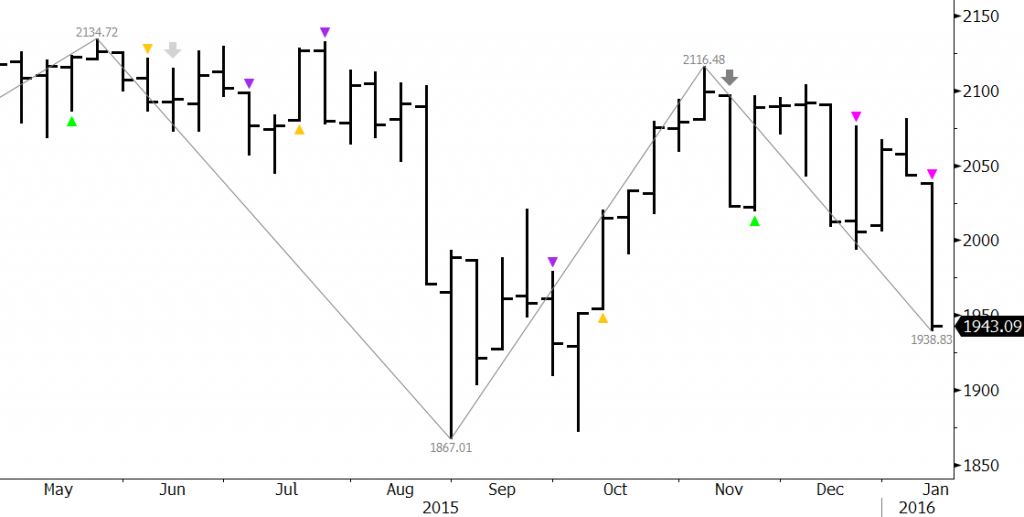
DIS’s December decline, from a technical standpoint, is most likely a correction of the longer-term move up, and the breaking point is $101.3. Our price forecasting model, based on various components of technical analysis, shows that the long-term outlook for DIS is positive, but that the downward correction could extend in coming weeks before DIS overcomes key resistance at $114.5.
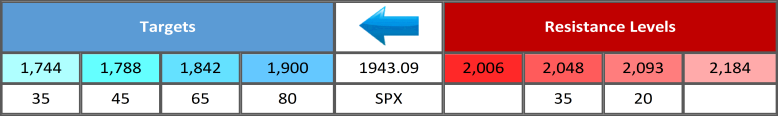
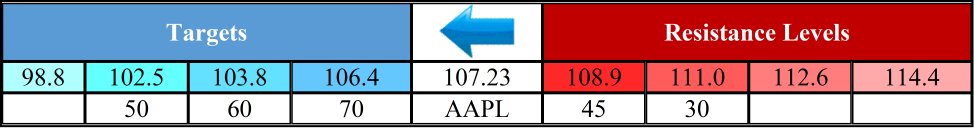
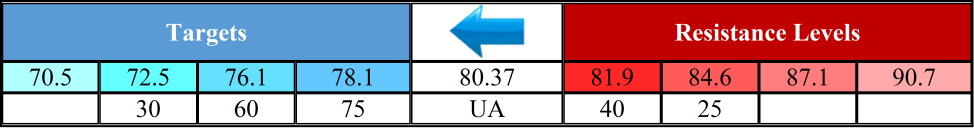
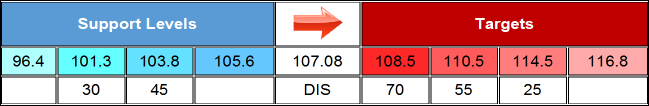
The following table shows the near-term targets and support levels along with probabilities of meeting those targets and levels within the next 10 trading days. This is a short-term forecast, but the implications of targets and levels discussed could have a long-term impact on the share price of DIS.
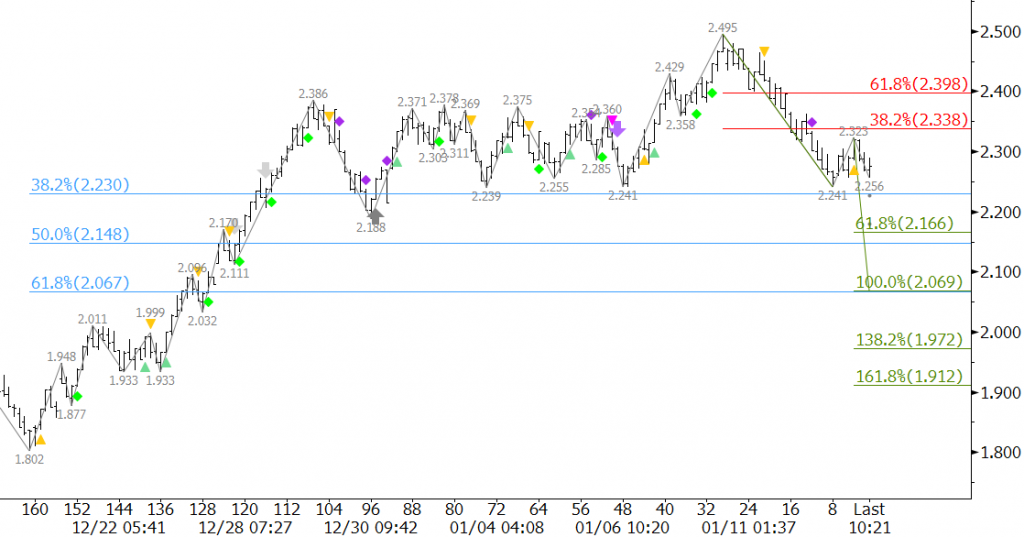
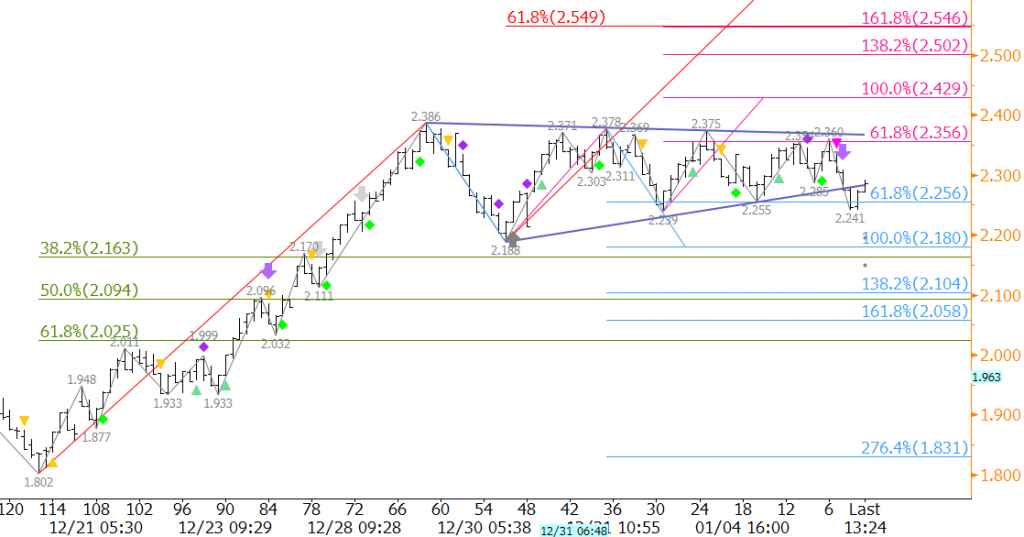
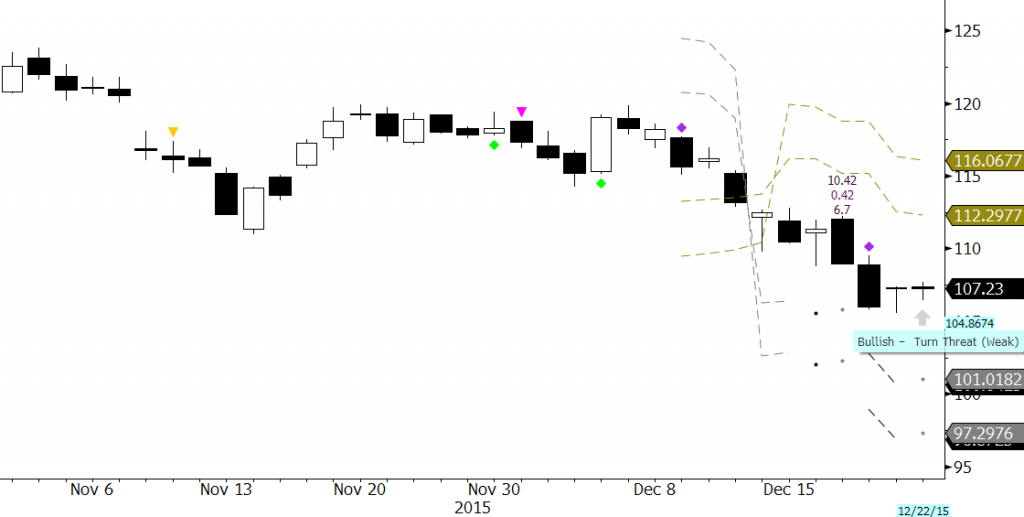
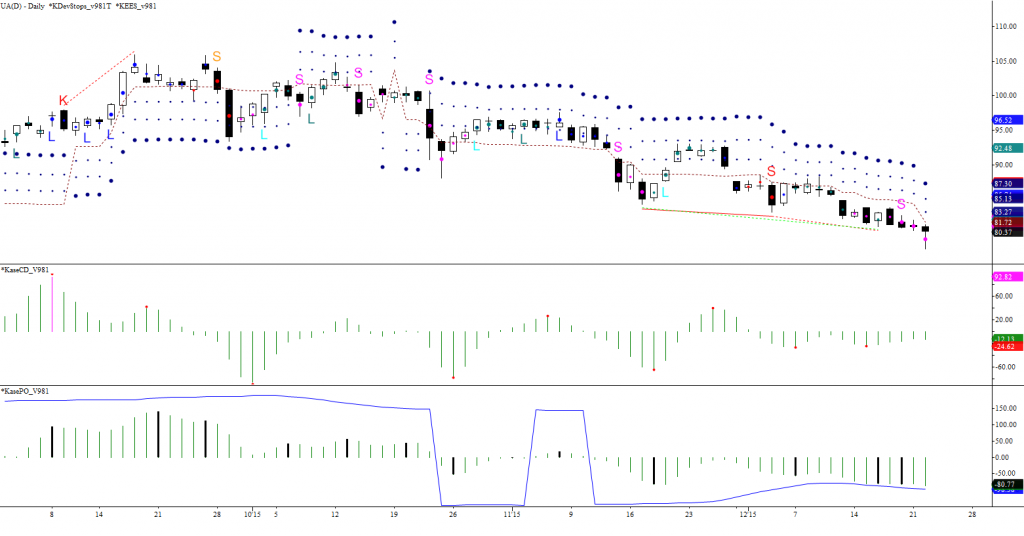
On Monday, December 28, KaseX confirmed a bullish turn signal (green arrow) and a first buy signal (yellow triangle). The combination of these two signals is called a pierced dart, and is usually a strong buy. The pierced dart puts short term odds in favor of a move to at least $108.5. This then connects to $110.5 and $114.5. A close over $114.5, which is near the 62 percent retracement of the decline from $120.65 to $104.3 and the $114.75 swing high, would indicate the long-term bullish move is going to continue.
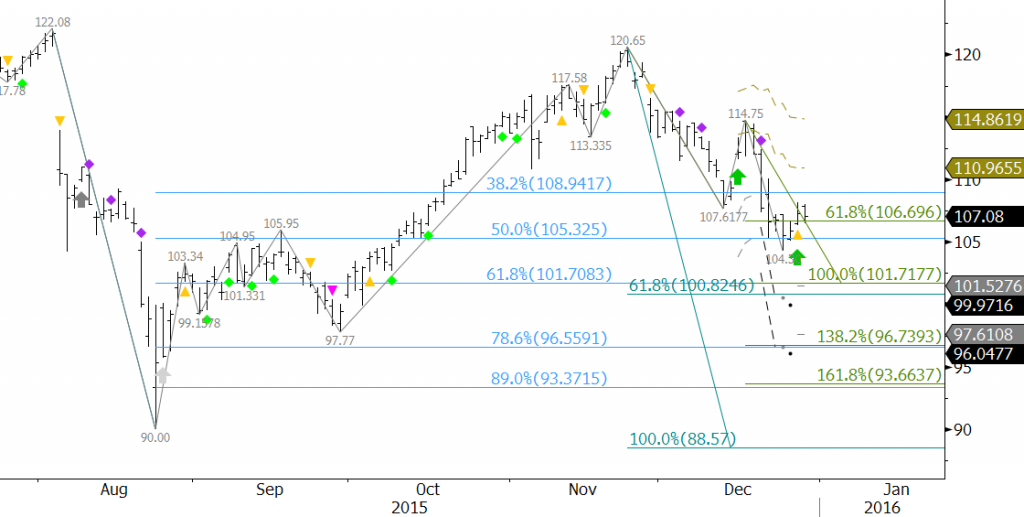
However, the wave formations down from $120.65 and $114.75 indicate a deeper test of support might take place first. This hinges on a close below $105.6, which is near the 62 percent retracement of the move up from $104.3. A close below $105.6 would shift near-term odds in favor of a deeper test of support with $103.8 and $101.3 as the next thresholds.
The reason that $101.3 is the breaking point for DIS is that it is the 62 percent retracement of the move up from $90.0 to $120.65, the 1.00 projection for the wave $120.65 – 107.62 – 114.75, and the 0.618 projection for the wave $122.08 – 90.0 – 120.65. A close below $101.3 would not only call for the decline to extend to $96.4 and $93.7, the 1.382 and 1.618 projections of the wave down from $120.65, but possibly $88.6, the 1.00 projection of the wave down from $122.08.
The confluence at $101.3 indicates that DIS shares will be hard pressed to close below this level. We do not expect $101.3 to be broken, and as long as this level holds, it means Walt Disney Co.’s “Essence of the Force Strategy” is working and there may be a good buying opportunity on a move back up from $101.3 if prices slide this low.
This is a brief technical analysis of DIS based upon Kase’s technical forecasting models and trading indicator KaseX. If you are interested in taking a trial of KaseX please contact sales@kaseco.com. We would love to get your thoughts about the forecasted targets and probabilities. Leave a comment or send them along with your request for a trial to sales@kaseco.com.