Crude Oil Forecast: June WTI Poised for Decline to at Least $42.5

Supply disruptions due to wildfires in Alberta and militant attacks in Nigeria were reportedly offsetting rising stockpiles of crude oil and surging OPEC output. However, those factors seem to be easing, and may not have as much of an impact on supply as originally indicated.

U.S. crude inventories reached their highest level since 1929, but rig counts continue to decline and U.S. output reportedly dropped the most in eight months during the week ended April 29.

Some analysts and traders believe the move up may have been too much too fast, and that the market is taking a much needed breather after rising four weeks in a row prior to last week. Sentiment is also becoming more negative, indicating the move down should extend.

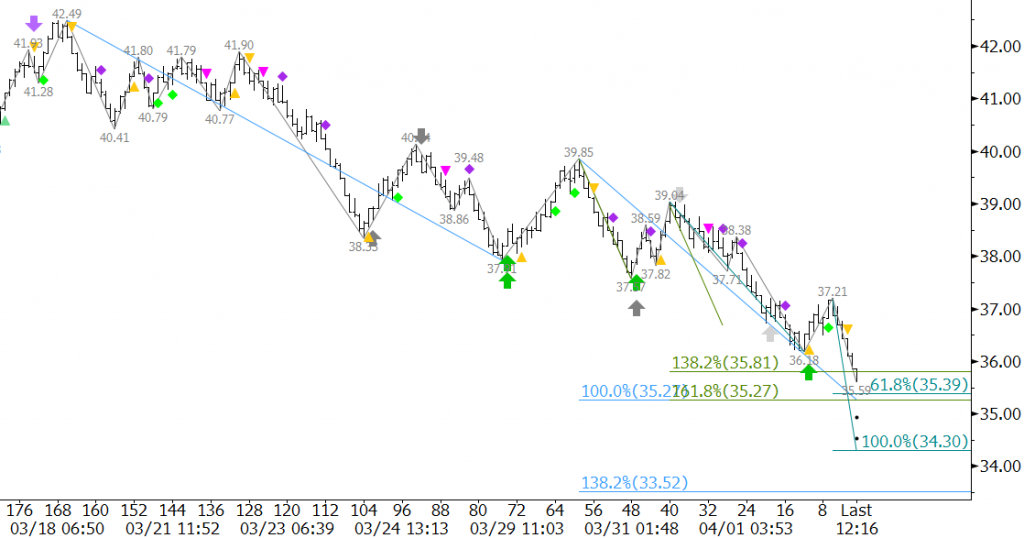
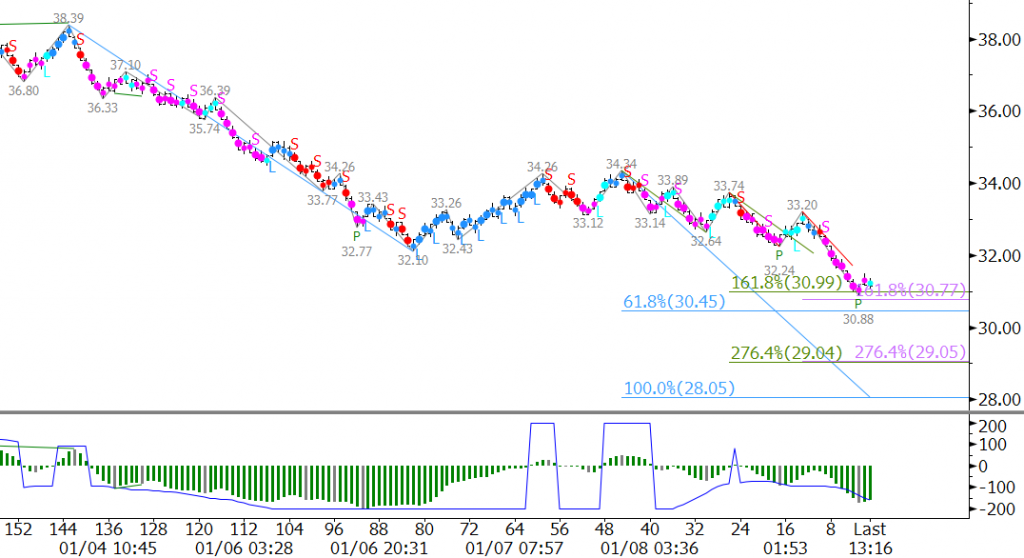
June WTI crude oil challenged key resistance at $46.1 a few times over the past several days. This level has held so far, and should continue to hold as the corrective move down extends. The wave formations down from $46.78 and $46.07 indicate June should decline to at least $42.5. This is a confluent wave projection and the last major swing low. A close below $42.5 would call for $42.0 and lower.

crude oil
crude oil

That said, at this point, we do not foresee that prices will fall apart. We expect trading to remain choppy. Look for $44.3 to hold upon a test of resistance early tomorrow before the decline continues. Crucial resistance for tomorrow is $44.9. We doubt prices will rise this high unless spurred by random events. Key resistance remains $46.1. A close above $46.1 would indicate the correction is over, and in turn, open the way for the next leg higher.

This is a brief analysis and outlook for the next day or so. Our weekly Crude Oil Commentary is a much more detailed and thorough energy price forecast. If you are interested in learning more, please sign up for a complimentary four-week trial.

Natural gas continues to send mixed signals on a day-to-day basis. However, that is pretty typical for this time of year during the shoulder months ahead of summer. Natural gas is trying to gauge the prospects of a recovery or a continued decline over the course of the longer-term, but it needs to gather more information first. With all current factors considered, it is looking like natural gas is settling into another trading range, though the boundaries of the range are still being determined.

For now, odds still favor a decline. June natural gas met the 0.618 projection for the wave $2.304 – 2.042 – 2.195 at $2.026 on Monday. Waves that meet the 0.618 projection typically extend to the 1.00 projection, in this case $1.93. Therefore, unless $2.195 is overcome, odds ultimately favor $1.93.

NGM6 20150504
natural gas

That said, the wave up from $2.026, aided by today’s close over $2.14, shows potential to extend to its 1.618 projection of $2.19. This is near the $2.195 swing high and the 62 percent retracement of the decline from $2.304 to $2.026. A move above $2.195 would take out the wave down from $2.304 that projects to $1.93 and lower, and in turn, shift odds in favor of $2.28 and higher.

First support is $2.06, the 0.618 projection of the wave $2.195 – 2.026 – 2.16. A close below this would take out the wave up from $2.026 and the near-term potential of overcoming $2.195. This would also open the way for another attempt at $2.00 and lower.

The key over the next few days will be either a move above $2.195 or below $2.061. As stated, odds favor the decline, but it is a very tight call right now.

This is a brief natural gas forecast for the next day or so. Our weekly Natural Gas Commentary is a much more detailed and thorough analysis. If you are interested in learning more, please sign up for a complimentary four-week trial.

The failure to reach an agreement to freeze crude oil output levels for key producers caused prices to slide in early trading Monday. June WTI gapped down from Friday’s $41.19 low and met crucial support at $39.0. However, the labor strike in Kuwait, which has decreased the nation’s output by nearly 60 percent for the second straight day, lent support to the market. June WTI rose to $41.66 and settled at $41.19 on Monday.

The bounce to $41.66 filled the gap and fulfilled the 1.00 projection of the wave $39.0 – 40.92 – 39.81. The move up may gather some strength from the strike in Kuwait and extend a bit higher on Tuesday. However, from a technical standpoint, the move up from $39.0 was not unusual. Gaps are usually filled, and as stated, the move up from $39.0 has already met technical resistance near $41.66.

CLM6 20160418
crude oil

Without support from bullish fundamentals or further random events (such as the strike in Kuwait), we expect prices to grind their way lower to support at $40.6 and $40.0 over the next few days. $39.0 remains key, and a close below this would open the way for major support in the mid $30s.

That said, a close over $41.7 would call for $42.5 and possibly $42.9. At this point, we don’t expect to see prices rise above $42.9.

This is a brief analysis and outlook for the next day or so. Our weekly Crude Oil Commentary is a much more detailed and thorough energy price forecast. If you are interested in learning more, please sign up for a complimentary four-week trial.

The highly anticipated and headline grabbing April 17 meeting between OPEC and non-OPEC nations has set the stage for crude oil’s rally. However, some traders and pundits still think the world is awash in oil and an out-put freeze has already been priced in. They anticipate an agreement to freeze production—if reached—would have little near-term impact.

Others believe slipping U.S. oil production is the most likely and more logical culprit for the price rise and could continue to lead the way higher. In addition, the sliding U.S. dollar and Federal Reserve officials’ optimistic statements on Friday morning regarding the U.S. economy and flat interest rates have also been interpreted as bullish.

From a technical standpoint the move up is poised to continue. Last week, WTI held the 62 percent retracement of the move up from $30.67 to $42.49 when prices fell to $35.24. This was important because the move up from $30.67 forms Wave III of a potential five-wave pattern. WTI is now forming a potential Wave V, but must overcome key resistance at $42.8 to prove that is the case. $42.8 is a confluent projection for Waves I and III, so a close over this would shed a much more bullish light on WTI.

CLK6 20160411

Look for initial resistance at $40.9 and $41.6. These are important projections for the wave up from $35.24 and potential stalling points. We expect to see at least a small pullback (21 to 38 percent retracement) once $41.6 is met. A close over $41.6 will significantly increase the odds of challenging $42.8,

Look for support at $38.7 and $37.3. A close below $37.3 would indicate the move up has likely failed, and that another test of $35.2 will take place.

This is a brief analysis and outlook for the next day or so. Our weekly Crude Oil Commentary is a much more detailed and thorough energy price forecast. If you are interested in learning more, please sign up for a complimentary four-week trial.

Last week May natural gas formed a double top at $2.03. The confirmation point for the pattern was $1.837, the swing low between the two peaks of $2.032 and $2.028. May rose above the $2.03 double top, but failed to close over this crucial level on both Monday and Tuesday. This was negative and set the market up for a test of major support.

Today’s close below the $1.925 swing low indicates May should now challenge the $1.837 swing low. A move below this would take out the wave up from $1.731 and significantly dampen the potential for the upward correction to continue. Look for initial support tomorrow at $1.86, the 62 percent retracement from $1.731 to $2.074.

NGK6 20160406

That said, the wave $2.074 – 1.982 – 2.041 met its 1.618 projection at $1.89. Therefore, be mindful of the potential for a small upward correction in early trading tomorrow. Currently, our models show resistance at $2.03 and $2.07. We expect $2.03 to hold.

This is a brief natural gas forecast for the next day or so. Our weekly Natural Gas Commentary is a much more detailed and thorough analysis. If you are interested in learning more, please sign up for a complimentary four-week trial.

Saudi Arabia once again made clear they will only freeze output at current levels if other nations, including Iran, also do so. Iran has balked at the idea and stated objections on numerous occasions. Reports indicate this came as a shock to bullish oil traders, some of whom had thought the Saudi’s softened their tone and have been more willing to discuss a deal.

On Friday, May WTI futures finally closed below crucial support at $37.8. The move down extended on Monday and is quickly closing in on crucial support at $35.3. This is a confluent wave projection for the waves down from $42.49, $39.85, and $39.04. It is also near the 62 percent retracement of the move up from $30.67 to $42.49.

CLK6 20160404

The confluence of projections and retracements at $35.3 make it a potential stalling point. However, so far, the market has not shown reason to believe the recent decline will end. A close below $35.3 would open the way for $33.6 and lower where extremely important targets protecting the May contract low will be tested.

Prices will likely bounce soon, but that will not mean that the move down is over. Look for initial resistance at $36.6 and key near-term resistance at $38.2. We expect that for the time being there will be plenty of selling pressure upon retracements to these levels.

This is a brief analysis and outlook for the next day or so. Our weekly Crude Oil Commentary is a much more detailed and thorough energy price forecast. If you are interested in learning more, please sign up for a complimentary four-week trial.

By Dean Rogers

It looks as though the natural gas rally has stalled and that prices will most likely settle into a trading range. The move up had been resilient for the past few weeks, reaching a crucial target at $1.91 and nearly extending to key resistance just above $2.00. However, the lack of a positive shift in underlying fundamentals has put a lid on prices, for now.

April natural gas is poised to test key support at $1.74 ahead of the holiday weekend. Wednesday’s close below $1.80, the 0.168 projection of the wave $1.957 – 1.796 – 1.899, has shifted odds strongly in favor of at least $1.74, the 1.00 projection. This is also the 62 percent retracement of the move up from $1.611 to $1.957. A close below $1.74 would call for $1.68 and very likely $1.65. The latter is the 1.618 projection, 89 percent retracement, and last support protecting the $1.611 low.

NGJ6 20160323

Longer-term, the outlook for natural gas remains bearish. However, we do not foresee prices making new lows yet. The most likely scenario, during the first few weeks of injection season, is a trading range between nominally $1.65 and $1.95. This is similar to the type of range seen last year between $2.55 and $2.95.

There is a reasonable chance that prices will test Wednesday’s $1.83 midpoint before declining to $1.74. This is also the 38 percent retracement of the move down from $1.899. A close over $1.83 would call for $1.90 again. This is key resistance because a move above $1.90 would wipe out the wave down from $1.957 and its potential to extend to $1.74 and lower.

This is a brief natural gas forecast for the next day or so. Our weekly Natural Gas Commentary is a much more detailed and thorough analysis. If you are interested in learning more, please sign up for a complimentary four-week trial.

By Dean Rogers

S&P 500 Index (SPX)

It has been a rough start for investors and the stock market so far this year. Falling oil prices and a weak economic outlook for China have soured the outlook for global markets and have indices across the world testing major support.

The technical outlook for the S&P 500 Index is negative. The index fell below its late August 2015 1867.01 swing low and has challenged major support at 1842 for the past few days. A few weeks ago we call for the S&P to test 1842 because of its confluence as a projection for major waves down from 2134.72 and 2116.48. This extremely important 1842 target was taken out by the 1812.29 swing low, but the index has not settled below 1842 yet.

Daily S&P 500 Index with KaseXSPX 20160121

The 1842 target has been adjusted to 1845 based upon the new wave formations and retracements. A sustained close below 1845 could open the way for the decline to continue to at least 1771 and ultimately 1688 as indicated in the table below.

SPX-Table


The confluence of 1842 makes it a potential stalling point, and at minimum, a correction will likely take place before the move down continues. Resistance at 1910 should hold, but the key level for the near-term is 1938. A close over 1938 would not mean that the move down is over, but would rather call for an extended upward correction to 1986 and possibly 2056. A close over the latter would be bullish for the long-term outlook.

10-Year T-Note Futures (TY)

As stock prices have fallen some monetary funds have been shifting into fixed income. As a result, 10-Year T-Note futures have risen substantially in recent weeks. The move up is poised to continue, but several negative technical factors indicate a correction should take place first.

An important resistance level at 128’19 was overcome earlier this week. This was the 0.618 projection for the wave 124’19 – 130’00.5 – 124’14. Kase’s wave analysis studies show that once the 0.618 projection is met most waves will extend to at least the 1.00 projection, in this case 130’17. This is near our model’s confluence point of 130’0 and the most recent major swing high. A sustained close over 130’0 would call for 131’20 and very likely 132’16.

TY-Table


The retracements of the move up from 125’14 to 129’08 define crucial support levels in coming weeks. As stated, a correction is expected, and a normal correction should hold 127’25.5. A close below this would call for an extended correction to key support at 126’25.5. If the move up is going to have any chance at continuing in coming weeks 126’25.5 must hold.

Daily Continuation 10-Year T-Note Futures with KaseXTY1 20160121

These are brief technical analyses based upon Kase’s technical forecasting models and trading indicators KaseX and Kase StatWare. If you are interested in taking a trial of KaseX or Kase StatWare please contact sales@kaseco.com. We would love to get your thoughts about the forecasted targets and probabilities. Leave a comment or send them along with your request for a trial to sales@kaseco.com.

By Dean Rogers

Natural gas fell back into the trading range between $2.23 and $2.39 where it spent the first week of the new year. This comes after the failure to extend to the 0.618 projection of the wave $1.802 – 2.386 – 2.188. There is still an outside chance the move up will extend to $2.56 while $2.188 holds, but overall, the charts do not look good and odds favor a decline to test major support.

The move down from $2.495 broke down into five waves that terminated near $2.241. Today’s small move up to $2.323 was the type of three-wave correction that would be expected after a five-wave pattern. This keeps short-term odds in favor of the decline below key support at $2.23. Upon a close below $2.23 look for $2.17, the 0.618 projection of the wave $2.495 – 2.241 – 2.323. This then connects to $2.07 as the 1.00 projection. These are also the 50 and 62 percent retracements of the move up from $1.802 to $2.495, respectively.

NGG6 20160113

Today’s Harami line and star setup is positive, but the star’s blow-off high dampens the likelihood of a turn higher tomorrow. A surprise bullish withdrawal reported by the EIA tomorrow morning could push prices higher, but based upon the price action for the past few days it looks as though most market participants expect the decline to continue.

This is a brief natural gas forecast for the next day or so. Our weekly Natural Gas Commentary is a much more detailed and thorough analysis. If you are interested in learning more, please sign up for a complimentary four-week trial.

By Dean Rogers

China’s stock market plunge wreaked havoc on stock and commodity prices around the world last week. Fears of a further slowing economy in the world’s largest energy consumer along with weak manufacturing demand and the deepening global supply glut have recast a negative outlook on oil prices. The negative sentiment has been reflected in the technicals too as prices continue to fall.

February WTI fell to $30.88 on Monday and came close to meeting a crucial confluence point at $30.6. This is near the 0.618 projection of the wave $38.39 – 32.1 – 34.34, and is the last support protecting against a decline into the $20s. A close below $30.6 would call for at least $29.0 and likely $28.1. The latter is the 1.00 projection for the wave down from $38.39.

CLG6 20160111

The KasePO PeakOut (green P) indicates Monday’s $32.2 midpoint might be tested early Tuesday, but we expect this level to hold. Other than the intraday PeakOut there is little to no technical evidence that the decline is going to stall. Therefore, without some type of unexpected shift in the underlying fundamentals and/or technicals we expect to see prices fall into the $20s soon.

This is a brief analysis and outlook for the next day or so. Our weekly Crude Oil Commentary is a much more detailed and thorough energy price forecast. If you are interested in learning more, please sign up for a complimentary four-week trial.