Midweek Natural Gas Forecast – June 10, 2015

This is an important time for natural gas because the market is moving out of the spring shoulder months and into summer. The market had been poised to test the contract lows, which it did, but the lows held and prices reversed higher this week.

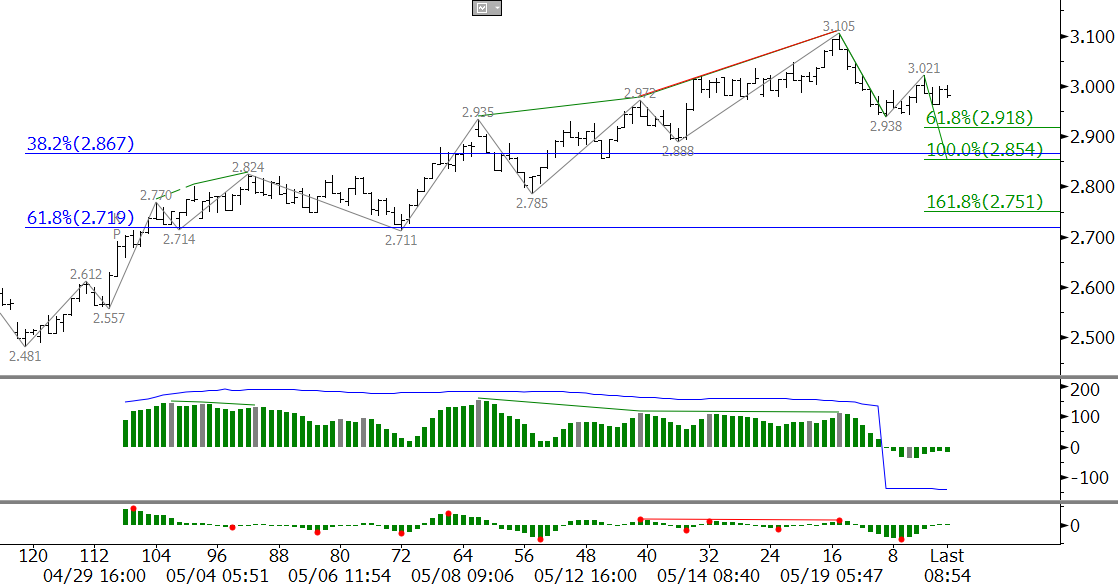
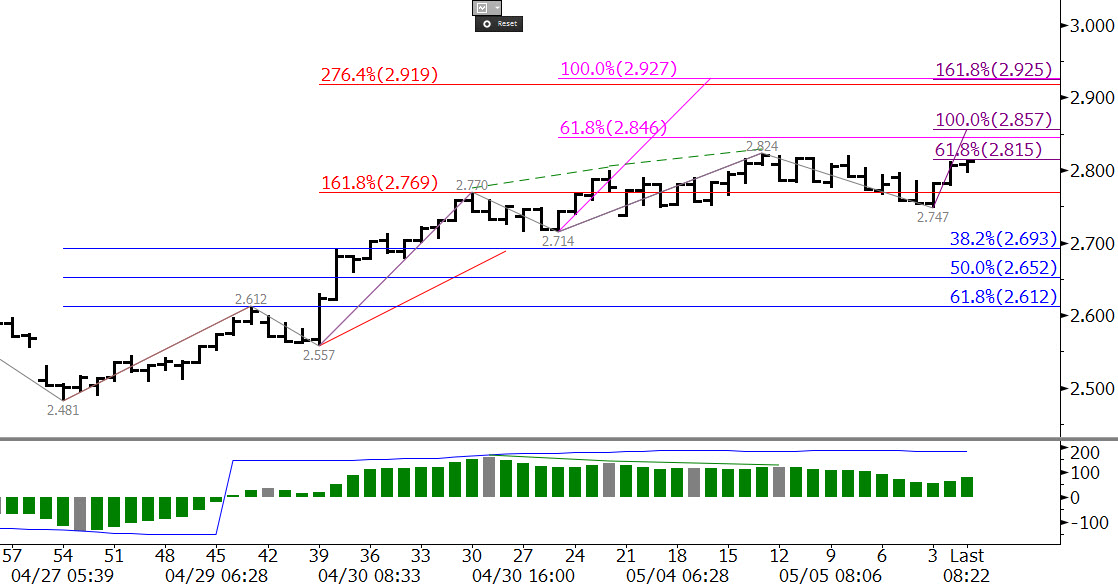
The July natural gas futures contract closed above $2.78 resistance on Tuesday and was driven by warmer temperatures in much of the eastern half of the U.S. To sustain the move warm weather will need to persist and key resistance at $2.92 must be overcome on a sustained closing basis. The market tested $2.92 in early trading Wednesday, but this level has held on a closing basis so far.

natural gas forecast

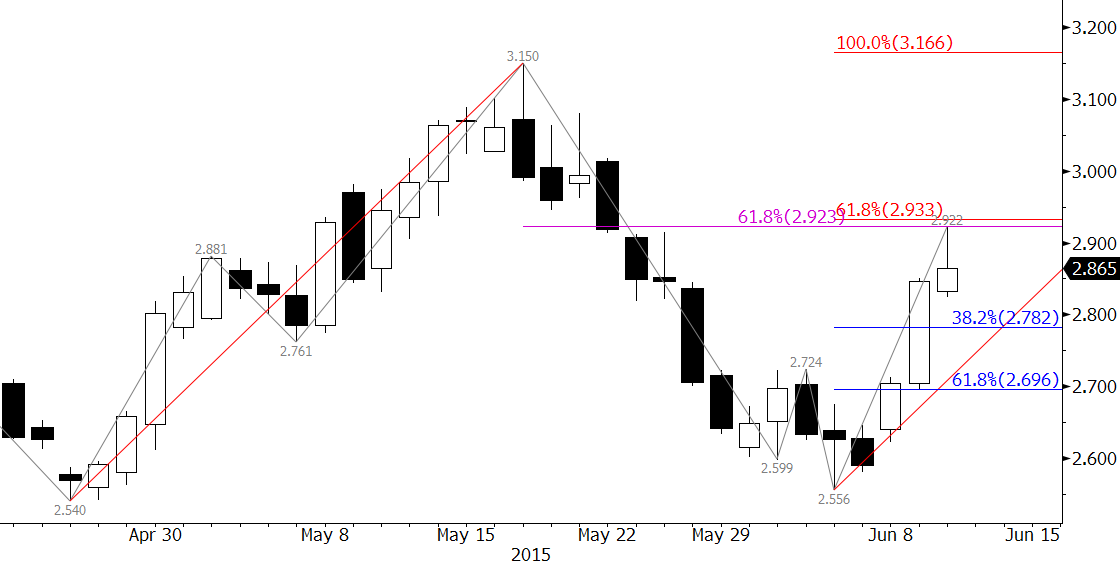
The $2.92 target is the gateway for a sustained summer rally because it is currently the most confluent target on the chart and makes connections to targets near, and well above, July’s $3.15 swing high. It the 62 percent retracement from $3.15 and the 0.168 projection for the move up from $2.54. A close over $2.92 will call for July’s $3.15 swing high to be challenged because the 1.00 projection for the wave up from $2.54 is $3.166.

The $2.92 level will probably be overcome in early trading tomorrow on an intraday basis, but again, the key will be a sustained close over $2.92. In fact, if there is another bearish EIA storage report tomorrow, the move up could stall.

First support is near yesterday’s $2.77 candlestick midpoint and the 38 percent retracement of the move up from $2.556. If the outlook is going to remain positive for at least the next few weeks then $2.77 should hold. Key support is $2.70, the 62 percent retracement. A close below this would put the market back into a cycle of testing the contract lows again.

This is a brief analysis ahead of tomorrow’s EIA report. Our weekly Natural Gas Commentary is a much more detailed and thorough analysis. If you are interested, please sign up for a complimentary four week trial.

WTI crude oil prices have been oscillating in a downward sloping channel for the past few weeks and the decline has formed a bullish continuation pattern. Although the formation is not a perfect flag, pennant, wedge, or triangle, it does appear to be corrective. More often than not corrective patterns like this ultimately break higher and the original up trend extends.

Crucial support at $57.0 held on a closing basis last week and Friday’s move up and the attempt to close over the upper trend line of the formation on Monday indicates prices should rise to at least $61.6 over the next few days.

WTI crude oil prices

Monday’s hanging man is negative, but so far Friday’s $59.13 midpoint has held. This is also the 38 percent retracement of the move up. A close below this would complete the hanging man and call for another oscillation lower to test support and possibly the lower trend line of the corrective formation.

This is a brief analysis and outlook for the next day or so. Our weekly Crude Oil Commentary is a much more detailed and thorough WTI and Bret crude oil price forecast. If you are interested, please sign up for a complimentary four week trial.

Natural gas’ pullback still appears to be corrective, but has positioned itself to test a crucial decision point at $2.71. This is in-line with the $2.711 swing low, the 1.618 projection of the wave down from $3.105, and the 61.8 percent retracement of the move up from $2.443.

natural gas

The $2.71 objective should be challenged ahead of tomorrow’s EIA report, which is confirmed by KaseX’s short signals on the $0.035 KaseBar chart today. The confluence, positioning, and importance of $2.71 leads us to believe that it will hold, at least initially, and will be followed by a trading range similar to the one seen throughout March.

This is a brief analysis ahead of tomorrow’s EIA report. Our weekly Natural Gas Commentary is a much more detailed and thorough natural gas forecast. If you are interested, please sign up for a complimentary four week trial.

Gasoline futures formed a double top at approximately 209.5 after attempting to overcome this crucial area of resistance in early trading Tuesday. The double top and confirmed dark cloud cover call for at least 195.0. This is a crucial decision point for an extended correction because 195.0 is in line with the 196.21 swing low and 38 percent retracement from 169.25. A close below 195.0 will confirm the double top and open the way for its target near 183.7, which is also near the 62 percent retracement.

Take a trial of Kase’s weekly energy forecasts.

gasoline

For the past few weeks many traders have doubted the rationality of natural gas’ price surge and have been looking for a stalling point. It is hard to argue with the charts though, and our analysis, based purely on what is happening on the charts, has called for $3.05 as a potential stalling point. We have stated in our weekly Natural Gas Commentary that a correction from $3.05 would likely take place as long as it held on a closing basis. The $3.05 target was overcome by the $3.105 swing high, but Tuesday’s blow-off high and key-point reversal on the daily chart, KasePO and KaseCD divergences on the $0.035 Kase Bar chart shown below, and failure to close over $3.05 indicate the move up has stalled and the anticipated downward correction is now underway.

natural gas

Today’s close below $2.92, the 0.618 projection of the wave down from $3.105, opens the way for $2.85. We are looking for the correction to extend to at least $2.85 and possibly $2.73 over the next week or so. Tomorrow’s EIA number will not likely influence the downward correction unless it is extremely bullish and out of line with expectations.

Ultimately, we see that support between $2.85 and $2.73 will hold and a trading range similar to the one experienced from mid-February until late March between approximately $2.73 and $3.05 will ensue while the market awaits directional confirmation from summer weather and/or other related factors.

For a more detailed analysis and in-depth natural gas forecast take a trial of the Kase Commentary on Natural Gas today!

For the past few weeks WTI crude oil prices have risen significantly, and for the first time since early December 2014 prices closed above $60.0 last week. However, many traders are questioning the long-term validity of the price rise continuing due to concerns of a persistent supply glut, and the technical factors show that the market reached a crucial decision point at $62.58 last week.

The June WTI futures contract met crucial resistance at $62.58 on Wednesday, May 6, and as called for in our weekly Kase Crude Oil Commentary, prices have begun to pullback in a corrective manner. The correction is taking place after a blow-off high and evening star setup formed that same day. The evening star (some might say shooting star) was both completed and confirmed on Thursday when prices closed below the midpoint and open of Tuesday’s Harami bar. In addition, bearish divergences on the KaseCD and KasePO were confirmed on Friday. The combination of negative short term technical factors indicates the downward correction should extend and will likely form Wave IV of a longer-term five wave formation that projects to target in the mid-to upper $60s and even the low $70s.

WTI Crude Oil

We expect the pullback to challenge at least $56.2. This is the 38 percent retracement of the move up from $45.93 and is near the bottom of the sub-wave 4 of III. If prices are going to extend to new highs in the next week or so, $56.2 must hold. Otherwise, a close below $56.2 would call for the 50 and 62 percent retracements at $54.3 and $52.3. For now, it looks as though $56.2 will hold. The long-term outlook would only shift back to being bearish upon a close below $52.3. We do not expect to see a decline of that magnitude.

Today’s decline was nominal, so the next few days will be crucial for the near-term direction. A close over last Thursday’s $59.82 midpoint would shift the near-term outlook back to positive, call for another test of $62.5, and likely open the way for the five-wave pattern to unfold to upper targets of $66.8 and $71.5 over the course of the next few months.

Take a trial of Kase’s weekly crude oil forecasts to receive more in-depth analysis every week.

After a good up month in April for the British Pound, some pundits are calling for weakness, and attributing this to the probability that post the UK’s May 7 election, formation of a coalition government is likely.

This virtual eventuality has been in the news for at least a couple of months. If it were so bearish, one would think it would have become a factor much sooner than six days before the election.

Despite the prospect of a coalition government, a coalition led by Cameron versus Miliband is not the same thing. The Economist endorsed Cameron notwithstanding some drawbacks, such as a possible alliance with anti-EU UKIP. It looks like his leadership, even so, would be better for the UK economically than one led by Miliband, whose cumulative redistributionist ideas could scare away high earners and entrepreneurs.

It’s been said that explanations are always after the fact. Let’s see what the British Pound/US Dollar is saying for itself.

The rise in value of the pound from April 13 to 29 has the characteristic of being driven by over exuberance. There are many opens that jumped higher than the previous day’s close, or if not, opened only a hair below. This looks like typical short-term emotionality.

The high of this move, 1.54969 failed to overcome that of more than two months earlier, 1.5512, so it’s not as if we’re talking about a major bull market here. Indeed all the bullish excitement has been about one up month, April. This overhyped month, though it had a reasonably large open-close range, failed to close over March’s open.

Technically charts show what’s called a piercing pattern, versus, an engulfing line. So though April “pierced” March’s armor, March was not engulfed. Clearly then this dampens April’s importance.

April was number 10 in a 10 month decline, and only the second to be an up month (the other was February). April made lows not seen since July 2010. The price low triggered a very mild oversold signal, but it’s not unusual for this to happen and be followed by a bit of a bounce.

Negating the importance of this is that overbought April, at least so far, has not been confirmed by and up closing May (again so far). The fact that May’s been down decreases the significance of the oversold signal, and even more so emphasizes a lack of disparity between negative momentum and negative trend.

The weekly is setting up a bearish pattern called a Harami star. A close below about 1.50, which is last week’s open-close midpoint, and the high for the week prior, would call for expectations to clearly look lower.

Indeed last week’s high was well above both its open and close. This means that prices tried very hard to climb up, fell right back down, in this case, to just below the where prices started the week.

Monthly and Weekly Candlesticks

GBPUSD

All markets have corrections, and often it’s expected that these will be of particular magnitudes. Here, another bearish factor is that the price decline smashed through the 38 percent retracement, and would now be expected to decline at least to about 1.503ish to meet next major retracement of 50 percent.

Bottom line is that the British Pound can’t tell us who will be the next Prime Minister, or whether a coalition must be formed, but it is telling us that it’s not feeling very well right now.

There have only been a few down days so far this month, and the down move may prove only corrective, but if we see a close below $1.50ish, then a retest of April’s low might become increasingly likely.

Charts created using TradeStation. ©TradeStation Technologies, Inc. 2001-2014. All rights reserved. No investment or trading advice, recommendation or opinions are being given or intended.

It is hard to deny the strength of the natural gas price rally over the past two weeks. Last week’s bullish engulfing line, April’s bullish hammer and morning star setup, and bullish daily divergences on the KasePO, KaseCD, MACD, RSI, and Stochastic are all technical evidence that the move down may finally be complete. However, many traders are skeptical of the move up and are asking what fundamental factors would support a recovery over the course of the longer-term. It is a fair and accurate question. Tomorrow’s U.S. Energy Information Administration (EIA) Natural Gas Weekly Update should provide a strong clue regarding the potential strength of a continued natural gas price rise.

In addition to the aforementioned bullish technical factors on the monthly, weekly, and daily charts, the short term technical factors and wave formations show evidence for a move to at least $2.93. This is a decision point because it is the 2.764 (XC – shown in red) projection for the wave up from $2.481, the 1.00 (E – shown in pink) from $2.557, and the 1.618 (L – shown in purple) from $2.747. In addition, $2.93 is the last level protecting mid-March’s $2.982 swing high. A sustained close over this would open the way for an extended move to targets above $3.00. However, $2.93 will not likely be tested until after tomorrow’s EIA report, if at all, because most traders are waiting for confirmation from another lower than expected build.

natural gas prices

There is good reason to be suspicious of this move up, and a disappointing EIA report tomorrow could be the catalyst to turn prices lower again in very short order. Therefore, until there is a sustained close over $2.93 caution is warranted.

The daily chart has formed a hanging man and evening star setup as of this mid-day analysis, and a close below Monday’s $2.78 midpoint would complete the pattern. This would then open the way for $2.65, the 50 percent retracement of the move up and last week’s midpoint. A close below $2.65 would confirm the move up is over and most likely point toward the market settling into a trading range while it sorts itself out.

Request a trial of our weekly energy forecast on natural gas to learn more.

Brent crude oil prices will likely test a key decision point at $68.0 this week. This is the 1.00 projection for the wave up from $50.1, and a confluent projection for the sub-waves up from $53.63. A close over $68.0 would confirm that a long-term bullish recovery is underway. Narrowing calendar spreads support the move up, but are still wide by historic standards. First class long permissions (blue dots) on the KEES indicator also confirm the positive tone.

That said, momentum is waning on the KaseCD and is setup for a bearish divergence (higher high in price with lower high in momentum). The KasePO is quickly nearing overbought territory. There are also a daily bearish hanging man and evening star setup. These and a few other negative factors tell us that Brent will likely stall at $68.0. We expect to see a significant correction take place to test the mettle of the market before the move up extends much higher than $68.0.

To learn more, take a trial of Kase’s weekly crude oil forecast.

Brent Crude

June WTI crude oil has oscillated in the range of a broadening wedge over the last eight trading days. The pattern is bullish, but the euphoria of WTI’s recent price surge is waning. Mixed technical and fundamental factors indicate the pattern will fail if the $58.41 swing high is not overcome soon.

Key technical support for the near term is $55.3 because it is the 1.00 target for the wave down from $58.82, and intersects with the lower trend line of the expanding wedge. This wave stalled at its 0.618 projection of $56.5, so the market is sitting on the teetering edge of a decline to $55.3 or push higher to overcome $58.41. A close over $58.41 would confirm a break higher out of the wedge and would open the way for an extended upward correction. A move below $56.5 would open the way for $55.3 to be challenged. Overall, odds are still slightly in favor of the move up and a break higher out of the wedge, but a close below $55.3 would indicate the pattern has failed.

For more detailed weekly analyses of WTI, Brent, and Natural Gas please take a trial of the Kase Energy Forecasts.

WTI Crude Oil