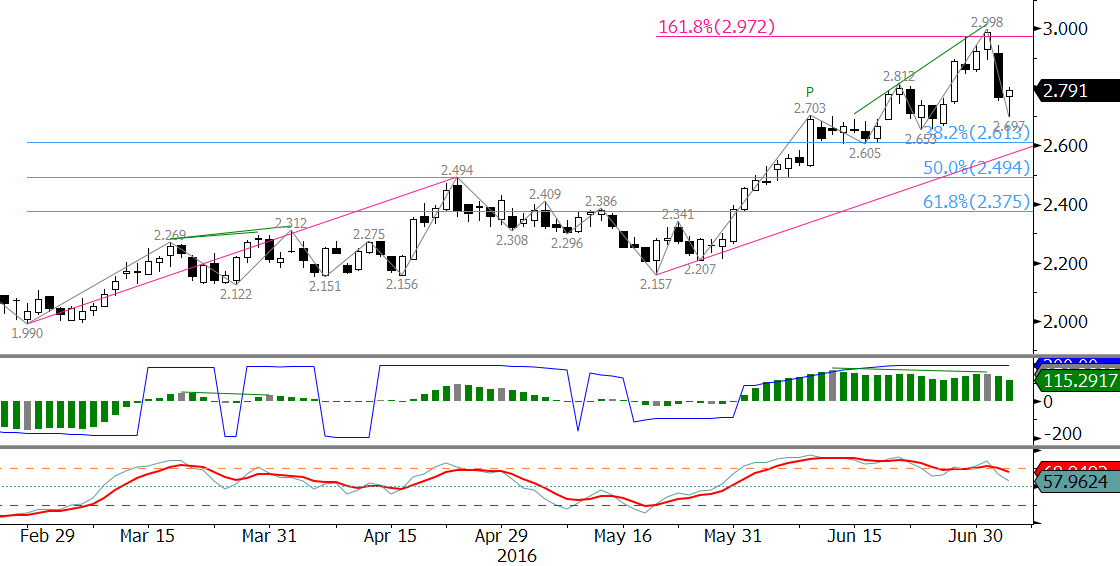
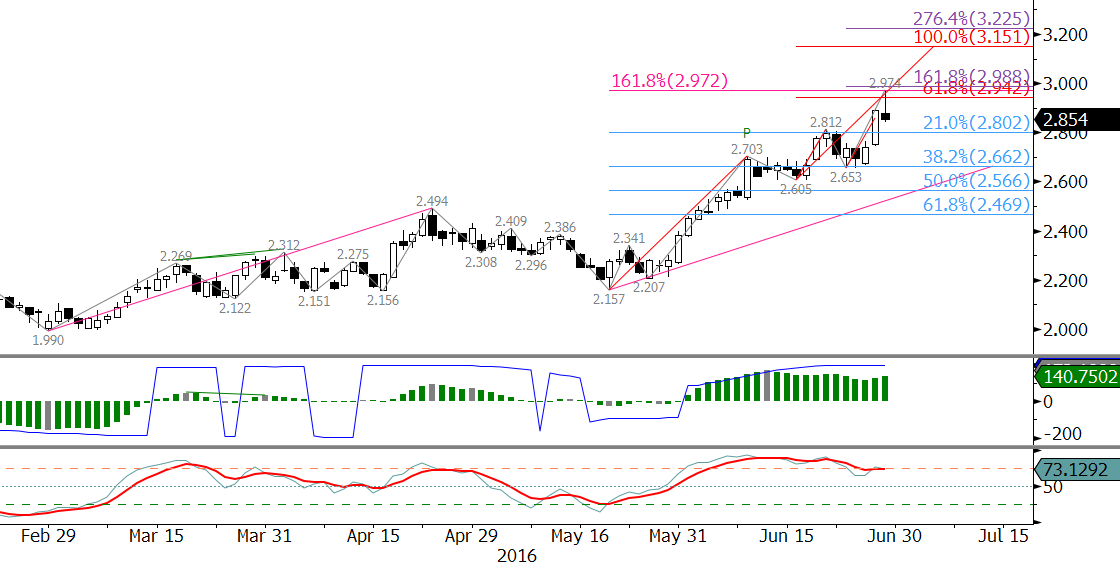
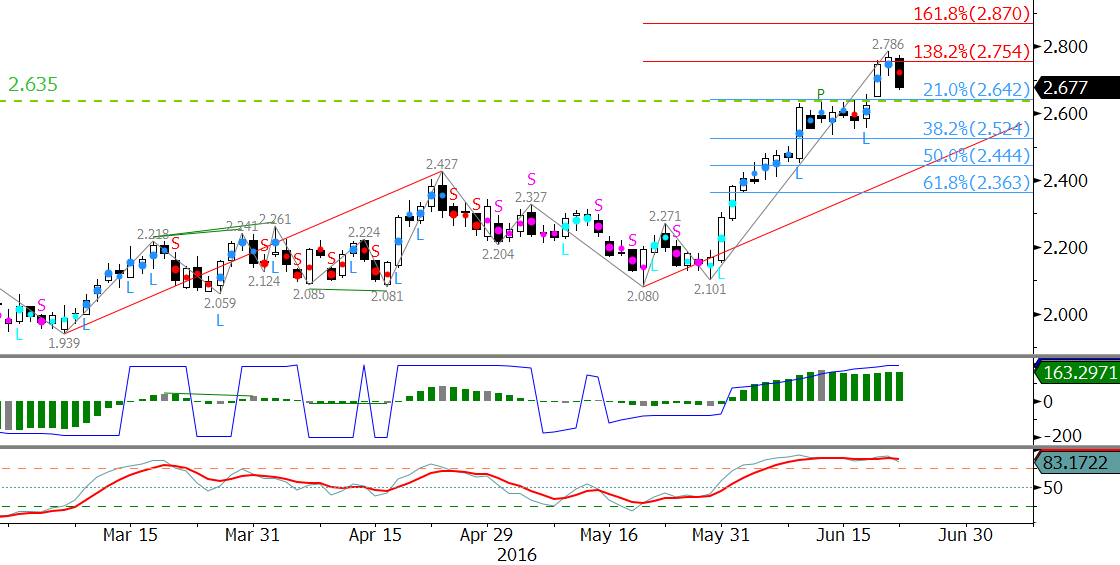
September natural gas’s correction down from $2.99 is extending after breaking lower out of a coil formation. Tuesday’s close below $2.66, the 0.618 projection of the wave $2.99 – 2.591 – 2.911, opened the way for the 1.00 projection at $2.51. The $2.51 target is also the 50 percent retracement of the move up from $2.009 to $2.99 and the 62 percent retracement from $2.195. Unless there is a bearish shift in underlying fundamentals, $2.51 should hold.
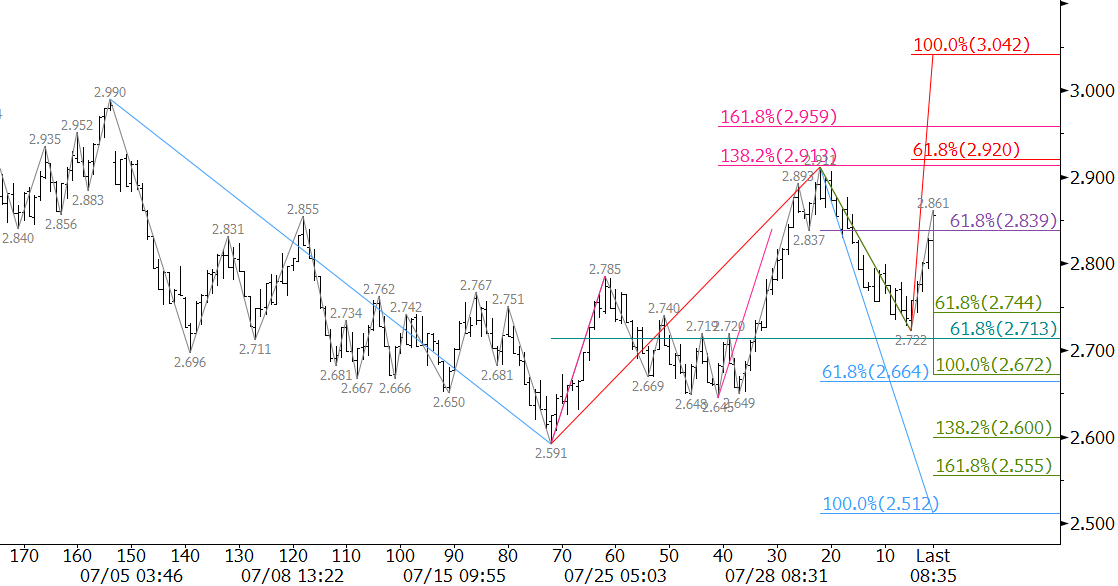
The KaseCD, a second derivative momentum indicator, is setup for bullish divergence on the daily chart. First resistance is $2.63. The key level for the near-term is $2.68. This is Tuesday’s midpoint and the 38 percent retracement of the decline from $2.911. A close over $2.68 would indicate September natural gas will most likely settle back into the recent trading range.
This is a brief natural gas forecast for the next day or so. Our weekly Natural Gas Commentary and intraweek updates provide a much more detailed and thorough analysis. If you are interested in learning more, please sign up for a complimentary four-week trial.