Natural Gas Forecast: Rising Towards Key Resistance

By Dean Rogers

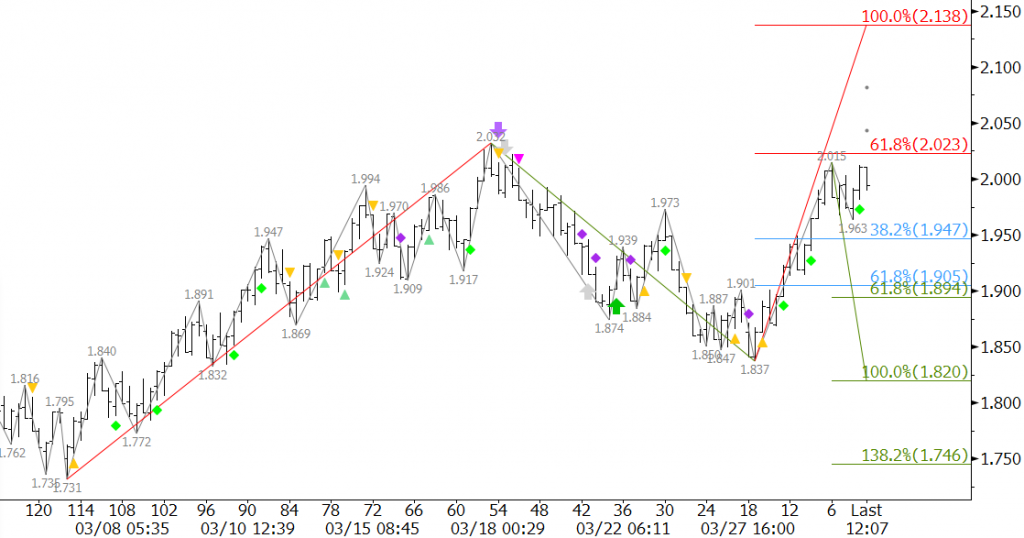
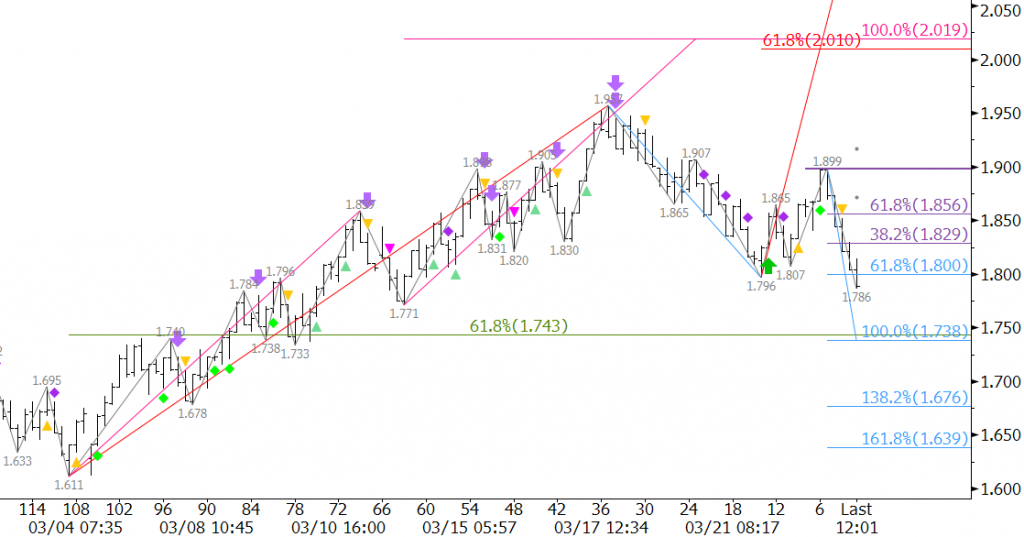
For several weeks natural gas has been trading within a range bound between $2.65 and $2.95, and more recently between $2.71 and $2.88. On Wednesday natural gas prices closed at the highest level since May 21 at $2.931, and the first class KEES permissions (blue dots) confirm the positive tone. Natural gas futures are now poised to overcome $2.95 and challenge $3.00. This is a confluent projection for the waves up from $2.656 and $2.706.

natural gas

A close over $3.00 will open the way for an extended upward correction, but keep in mind, this rally may be short lived as the end of summer and its warm weather are rapidly approaching. This upward correction may very well be the last hurrah before the end of summer, and it is going to be a lot easier for longer-term bears to short from $3.00 versus $2.70.

In addition, not only is the market is nearing a past failure point at $2.95, but both the KaseCD and KasePO momentum indicators are setup for bearish divergence. This is a signal that forms when higher price highs are accompanied by lower momentum highs. Bearish divergence is a signal that indicates the move up is exhausted.

Should price turn lower look for support at $2.85 and $2.70. These are the 38 and 62 percent retracements of the move up from $2.706 to $2.934.

This is a brief natural gas forecast ahead of tomorrow’s EIA report. Our weekly Natural Gas Commentary is a much more detailed and thorough analysis. If you are interested in learning more, please sign up for a complimentary four week trial. We also offer trials of our trading indicators.

By Big Hotel ImageCynthia Kase

Read on TraderPlanet.com

The big hotel chains recovered from the financial crisis well and until recent months showed steady gains. Diversification, appealing to differing guests, as well as shifting property ownership to partners helped heat the sector. But now, it looks like supply is catching up with demand, and now the sector is cooling off. To evaluate specifics, I’ve chosen to look at Starwood Hotels & Resorts Worldwide Inc. (HOT) this week as a proxy for its peers.

HOT’s been down for four months running, having lost about 14 percent of its value. The first major downside target is $73.0. If that breaks, a freefall to $65 could ensue, but $70, or $67.5 form interim support. These prices are reflected in the retracement tables shown below

Big Hotel Small Chart
Retracements from Lows to $87.99


Since Friday, there’s been a small correction, but HOT declined today, August 11. $78 could be tested, and a close over next resistance at $81 would call for a recovery.

Starwood (HOT) Technical Indicators

Looking at the technicals, Starwood’s monthly chart generated a negative divergence back in April based on the KaseCD. Four down months have followed, but lows have not yet reached Kase’s first stop level at $72.83. The stop is near a key target, centered on $73.Big Hotel Chart

The first wave of a pattern is always the most important. Here that’s 87.99 – 79.53 – 86.96, the 1.62 extension for which is $73. If the pattern extends, look for $65, the trend terminus. This is just above Kase’s second stop at $65.8. The most recent wave is 87.99 – 79.53 – 86.96, and $73 is its equal extension as well as the Phi-squared corrective projection.

Backtracking, July 31 was an aberrant, outside, down day. Prices spiked to $86.96 only make a $77.72 low. $73 and $65 are targeted by this day’s waves.

The last four days through Tuesday for a Harami line with stars. The daily chart is oversold, but not divergent. Prices rose about $1.50 from $75.57, but fell today. The wave up targets $78, which is its equal extension, as well as its Phi corrective projection. The wave also targets $81, using three different calculations. This is the “drop dead” price above which the tone becomes positive, and the highest price to which the small wave projects. These two resistance values are the midpoints for the August (so far) and July monthly candlesticks.

Recommended Starwood (HOT) Trading

If I were short above $86, I’d just stay short, perhaps scaling out at $78 and then $81, and exercising caution at the downside targets. Bearish intraday traders might time in here, but watch $73, and use tighter stops. Technically there is little room for optimism, but if you’re long on fundamentals, then monitor the downside targets. Above $81 – you’re “hot”.

Connect with me on LinkedIn for more Market Updates.

By Dean Rogers

For the past eight weeks September WTI crude oil futures have closed lower, and the decline is quickly approaching major support at $42.5. Many pundits claim the sky is falling, but it is usually at times like this that the market will finally find support and at least attempt to make a bottom.

We have discussed $42.5 as major target and potential bottom in our weekly blog update and in our detailed crude oil forecast for several weeks. There is no definitive evidence that the move down is going to end, but on Monday a few positive signs formed that indicate an extended upward correction may take place.

Monday’s bullish engulfing line, exhausted daily KasePO and KaseCD momentum, weekly divergence setups, and the intraday wave up from $43.35 all show that the upward correction may test $45.9 and possibly $47.5 before the decline continues.

wti crude oil

For now, there is no evidence that this will be a major correction, not yet at least, but the fact that the market is starting to show some positive signs of life could mean the move down will end soon.

That said, important resistance was met at $45.01, so we expect to see a pullback to $44.3, Monday’s midpoint, in early trading Tuesday. A close below $44.3 would negate many of the aforementioned positive factors and open the way for $42.5 to finally be met.

This is a brief analysis and outlook for the near-term. Our weekly Crude Oil Commentary is a much more detailed and thorough energy price forecast. If you are interested, please sign up for a complimentary four week trial.

By Dean Rogers

Crude oil has taken on a strong bearish tone. There is very little technical evidence, and even less fundamental evidence, that the decline is going to end. However, it is almost always darkest before dawn and there are a few factors that show a correction should take place soon.

Last week’s update discussed major support at $47.0 for WTI and September Brent crude oil is quickly approaching major technical support at $52.8. This is the 1.618 projection for $71.37 – 62.3 – 62.49, the 0.618 projection for $67.49 – 55.6 – 59.9, and the lower Bollinger Band. The KasePO, shown in the middle panel of the chart above, and KaseCD, in the bottom panel, are setup for divergence and nearly in oversold territory. These factors indicate $52.8 is a potential stalling point and that a correction might take place before the decline continues to the next targets.

Brent

A normal correction will hold $55.6, the 38 percent retracement from $59.9. Key resistance is $57.2, the 62 percent retracement. We expect $55.6 to hold before the next leg lower takes place.

This is a brief analysis and outlook for the near-term. Our weekly Crude Oil Commentary is a much more detailed and thorough energy price forecast. If you are interested, please sign up for a complimentary four week trial.

Natural gas is idling in neutral again and is struggling to overcome key resistance levels. We are still negative for the longer-term, but the near term outlook is looking slightly positive.

The small move up is confirmed by long KaseX signals (green diamonds) on the $0.035 Kase Bar chart. In addition, Wednesday’s close over $2.895, the 1.00 projection for the wave up from $2.785, has opened the way for its 1.618 projection near $2.96. The $2.96 target is crucial because it is the 0.618 projection for the wave up from $2.644. A close over $2.96 would call for an extended correction to targets above $3.00.

natraul gas

Other than the quick move up from $2.644, the recent move up has lacked conviction. A daily evening star setup and hanging man indicates traders are still not quite sure if the market is ready to make the push higher. Tuesday’s $2.84 open is first support, and a close below this would call for another test of the $2.785 swing low.

This is a brief natural gas forecast ahead of tomorrow’s EIA report. Our weekly Natural Gas Commentary is a much more detailed and thorough analysis. If you are interested in learning more, please sign up for a complimentary four week trial.

August natural gas is attempting to rally above $3.00 after stalling at $2.644 last Thursday. The surge over the last week may be a desperate attempt to push prices to targets above $3.00 before summer’s end, and is being driven by speculation of above normal temperatures through the end of this month and into August.

The near-term outlook took a positive turn Wednesday when prices closed above $2.884, the 0.618 projection of the wave $2.588 – 2.977- 2.644. This clears the way for a rally to the 1.00 projection of $3.03. This is a potential stalling point for the upward correction. A close over $3.03 would call for the $3.20 confluence point with intermediate resistance at $3.11.

natural gas

Caution is warranted though because it is a bit early to get overly exuberant about a bullish recovery. The balance of bullish and bearish factors is razor thin and shifts day-to-day. The move up is almost certainly corrective of the longer-term decline. Do not be surprised to see prices pull back and settle below $2.82 on Thursday should there be a disappointing EIA storage report. This, in turn, would call for $2.75 and lower.

This is a brief natural gas forecast ahead of tomorrow’s EIA report. Our weekly Natural Gas Commentary is a much more detailed and thorough analysis. If you are interested in learning more, please sign up for a complimentary four week trial.

Perfect geometric formations are a rare commodity. They are useful gems of information that can tell us a lot about a market’s outlook and general direction. It is important to pay attention to the implications of a successful break out of the pattern, and it is even more important to watch for patterns that fail.

WTI’s bearish flag on the $0.50 Kase Bar chart is as close to a textbook example as one will ever see. Flags are extremely reliable continuation patterns. Because this flag formed after a decline, and is sloping upwards, it is a bearish pattern that indicates the move up is corrective and that the decline should continue.

WTI Crude Oil

The waves within the flag have fulfilled the 1.00 projection for the wave $50.58 – 53.43 – 50.91. This is significant because it is evidence that the move up is unfolding as a three-wave ABC pattern, which is more evidence that the move is corrective.

Prices settled in the lower half of the formation on Monday, which does not bode well for another test of the upper trend line. A close below $51.8, which is near the bottom trend line, would indicate the move down is going to extend to at least $49.9. Our detailed weekly analysis discusses the connections to targets in the mid- to low-$40s upon a break lower.

There is an outside chance that the formation will fail, but prices will need to close over $54.8 to prove that an extended upward correction and potential recovery is underway. Technically, the flag will fail upon a close over the upper trend line, which is currently $54.2. However, for many technical reasons, $54.8 is the threshold for a positive near-term outlook. Most importantly, it is near the 38 percent retracement of the decline from $62.22 and the midpoint of July 6th.

For now, watch the flag formation closely. Odds favor a break lower and close below $51.8. The directional breakout of this pattern will be a strong clue as to the direction of WTI for the next several weeks.

This is a brief analysis and outlook for the near-term. Our weekly Crude Oil Commentary is a much more detailed and thorough energy price forecast. If you are interested, please sign up for a complimentary four week trial.

hogsby Cynthia A. Kase

Read on TraderPlanet.com

After last year’s viral outbreak that killed millions of hogs, pork production, now having recovered, looks to set records and overshoot demand. Apparently some commodity advisors are panicking and recommending that their producer clients use lean hog futures to hedge and avoid even lower prices. Is this a good idea?

To our view, hedging hogs today would be like closing the sty door after the pig has fled. In Kase’s energy practice, producers hedge when markets are enjoying high prices, not when already painfully low. At this point, defensive measures are called for.

The reason I’d be a reluctant outright seller or short hedger is that prices have been rising over the past few weeks, not falling. Looking at the August 2015 contract, prices fell from a 95.35 high last November to a 71.175 low June 22. Then the KasePO and KaseCD momentum indicators generated bullish oversold and momentum divergence signals. A 71.275 swing low followed, forming a classic “W” shape, or double bottom.

lean hogs

Last week’s candlestick completed a classic bullish morning star. However, the pattern remains unconfirmed until a close over 76.65, dampening the bullish tone. Also, the daily chart shows a potentially negative Harami line with two stars.

While the overall structure is down, the current 6 cent bounce could continue to 79 and maybe 81.5. A close over 81.5 hasn’t high odds right now, but if it happens we could see another 10 cents. 79 is the 2*1.38 extension and Phi2 corrective projection for 71.175 – 74.05 – 71.275. For the final wave up spanning from July 2 to July 7, 75.175 – 77.275 – 75.625, 79 is the 1.62 extension and 81.5 is both the trend terminus (77.2753/75.1752), and 2*1.38 extension.

If there isn’t a close over 76.65 soon, the rally might fail. A close below June 2s open, 75.15, followed by 72.4 would be cause for concern. A close below 70 could send lean hog prices squealing – potentially to 55 cents as, from a technical standpoint, targets ranging from 67 down to 55 have similar odds.

72.4 and 70 are KaseX stops. The key wave, 95.35 – 86.00 – 90.65, targets 70 as the important 1.62 extension. The last down wave, 77.275 – 75.625 – 76.625 targets 72.4 as the trend terminus (77.2753/75.6252), 2*1.38 extension and Phi3 corrective projection.

Here’s my hedging strategy. If you’re ok with “getting called”, sell calls above the market, maybe just above 81.5, perhaps purchasing puts on the downside with the funds depending on your risk appetite and whether you need to qualify for hedge accounting. Otherwise wait for a drop below 75.15 or so, then scale-in short calls maybe five cents or so above the market, again possibly buying puts. Meanwhile, grab a beer and a brat and watch the thresholds.

Send questions for next week to askkase@kaseco.com, and for energy hedging visit the Kase Energy Hedging Services page.

Charts created using TradeStation. ©TradeStation Technologies, Inc. 2001-2015. All rights reserved. No investment or trading advice, recommendation or opinions are being given or intended.

After the 4th of July weekend the energy markets, unlike the weather across most of the U.S., heated up. The lack of warm summer weather in key areas of the county has given way to lower prices for natural gas. August natural gas futures finally closed below $2.73 on Tuesday and Wednesday. The move has been quiet relative to the noise being made by crude oil, but the break lower indicates prices should continue to decline. That said, the bullish KaseCD divergence and KasePO PeakOut (oversold signal) on the $0.035 Kase Bar chart indicate the decline will be a grind.

natural gas prices

The wave $2.977 – 2.733 – 2.885 took out its 0.618 projection at $2.73, therefore odds favor at least $2.64, its 1.00 projection. This is a highly confluent and important target that protects the $2.588 swing low. We expect to see a bounce from $2.64 given its importance. A close below $2.64 would call for $2.55 and $2.50.

The 38 percent retracement from $2.885 to $2.676 is $2.76. Key near-term resistance is $2.81, the 62 percent retracement. Both levels are in line with the two previous intraday swing highs of $2.756 and $2.80. A close over $2.81 is unlikely unless tomorrow’s Energy Information Agency (EIA) report is extremely bullish.

This is a brief natural gas forecast ahead of tomorrow’s EIA report. Our weekly Natural Gas Commentary is a much more detailed and thorough analysis. If you are interested in learning more, please sign up for a complimentary four week trial.

As predicted WTI crude oil has broken lower out of the recent trading range and fell by nearly eight percent on Monday. The important 1.382 projection was met at the $52.41 swing low. Key support at $50.5 should be tested tomorrow. We consider this a decision point for a much more bearish outlook and decline into the mid-$40’s. Today’s action may even dust up talks about the $30s again, though we think that conversation is a bit premature. Look for resistance at Monday’s $54.4 midpoint. This may be tested in early trading Tuesday, but should hold.

wti crude oil

This is a brief analysis and outlook for the near-term. Our weekly Crude Oil Commentary is a much more detailed and thorough energy price forecast. If you are interested, please sign up for a complimentary four week trial.